The following article contains screeners and chart setups for trading with RSI and Stochastic RSI.
ASSSUMPTION: You know RSI and have viewed the Stochastic RSI and RSI-Stochastic RSI Screeners videos.
If not, please visit my YouTube Page and view them before reading this article:
Here’s how you set up screeners and trade after checking the videos (You can view the videos which coach you how to set up Fibonacci retracement and other tools)
WHAT SCREENER TO USE:
For India: Use Chartink or Trendlyne screeners
International: Use TradingView or per your choice
TRADING TOOLS CHECKLIST
-
10 EMA
-
VWAP
-
Fibonacci Retracements
-
RSI and Stochastic RSI
-
Day Charts
-
Check RSI Divergence on Day charts (AS PER VIDEO)
SCREENER 1 (BULLISH)
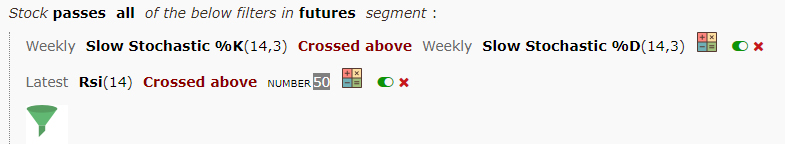
1.%K crosses above %D
and
2. RSI greater than 50
Periods to check: Month, Week, Day
Divergence to check: Day Charts
Entry:
Month Crossover – Short to medium term trade If RSI above 60 or buy OTM CE;
Week/Day Crossover – Short to medium term trade If RSI above 60
SCREENER 2 (BULLISH)
1.%K crosses above %D
and
2. RSI crosses above 55
Periods to check: Month, Week, Day
Divergence to check: Day Charts
Entry:
Month Crossover – Short to medium term trade If RSI above 60 or buy OTM CE;
Week/Day Crossover – Short to medium term trade If RSI above 60
SCREENER 3 (BEARISH)
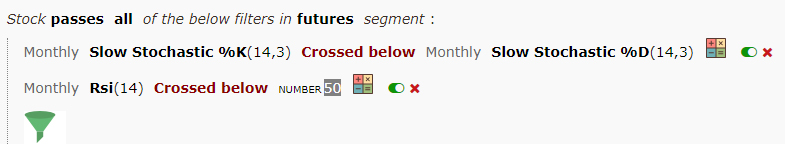
1.%K crosses below %D
and
2. RSI crosses below 50 (BULLISH)
Periods to check: Month, Week, Day
Divergence to check: Day Charts
Entry:
Month/Week/Day Crossover – Intraday trade or buy OTM PE if reasonably priced
SCREENER 4 (BEARISH-OVERBOUGHT)

1. Stochastic RSI greater than 95
and
RSI above 70
Periods to check: Month, Week, Day
Divergence to check: Day Charts
Entry:
Intraday trade
SCREENER 5 (BULLISH-OVERSOLD)

1. Stochastic RSI less than 5
and
RSI below 30
Periods to check: Month, Week, Day
Divergence to check: Day Charts
Entry:
Intraday trade
So this is it. If you have not viewed the videos yet and want to enrich your knowledge and learn how to trade, do head over to my YouTube Channel and subscribe. I’ll be posting tutorials regularly. Thanks.
Hello sir .
My self SOORAJ .
I tried rsi stochastic rsi in 1minute time period for finding break outs but the result was a failure . Can you suggest me any equations for finding breakouts before it starts.
I tried many equation like Macd / adx /Ema/ sma/ balance of power and many more cross overs for finding. Breakout .all of those are failures .
Give me a reply sir
I don’t recommend one minute time periods. Please view the videos again for periods to use.
gone thru’ the YT clips, tech wise excellent, communication professional n lucid. Its like “Khul ja Sim Sim” Look fwd for more such.
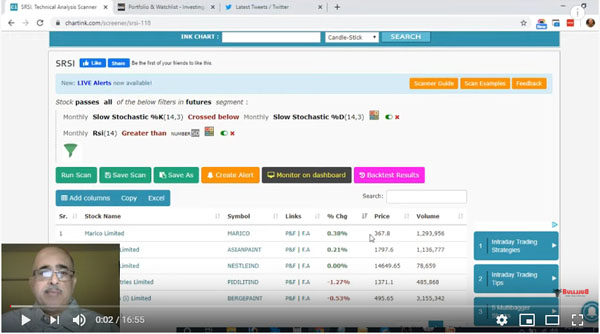
1 query: screeners are showing ‘results for Futures’ why?
anyways Thanks Sir!!