Volume Spread Analysis or VSA analyzes candles (or bars) and volume-per-candle to determine price direction by figuring out demand and supply.
It takes into account 3 key factors:
1. The quantity of Volume per candle (or bar).
2. The Range Spread – which is the High and the Low per candle.
3. The Closing Price, it’s relation to the Range Spread.
By the way, do you know about Candle formation? If not, do check this guide out.
Now, here is an example of the 3 key factors of VSA:

What you must know about VSA:
1. About 60% to 70% of a volume bar is of operators and institutions who are smarter than you and I.
2. You ALWAYS MUST CHECK multi time frames before analyzing volumes to determine support and resistance levels. Start with month – move to week – then check day – hour. Anything lower is noise. This is because operators know how to game chartists who check singular time frames.
3. Remember this if VSA indicates bullishness on lower periods and bearishness on higher time periods (or vice versa), it implies that the operators are trying to game traders. DO NOT FORGET ANALYZING MULTI TIME FRAMES WHILE DOING VSA.
4. Your job is to look for strength in down-bars and weakness in up-bars.
5. The close of the candle is extremely important. It must be correlated to the range (Check interpretation below). The open is not important.
6. VSA can be used on any time frame.
— Scalpers can use it on 3m-5m Candles
— Other Intra day traders can use it on 15m and 30m charts
— BTST traders can analyze VSA on 1H, 2H and Daily time frames
— Positional traders should analyze Daily, Weekly and Monthly VSA
7. You must compare the volume bar with the preceding 2-4 volume bars to determine smart money movement.
8. Before you head to the interpretation, you should know:
— How to check multi time frames
VOLUME SPREAD ANALYSIS INTERPRETATION
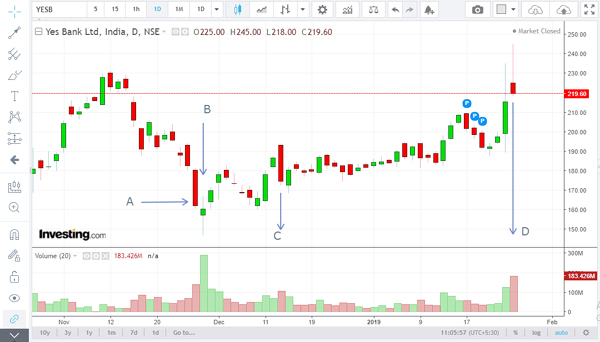
In this example, I have used the Yes Bank Daily Chart. Note that you can apply the interpretation below to any chart of your choice, and as suggested above.

A & C: LARGE CANDLE RANGE WITH RISING VOLUMES
In this example, the Volume bar is greater than the preceding 2-4 volume bars and the candle is red with a large body. The close is right next to the low of the day. This signifies that operators dumped the stock on that day and that the next open will be lower.
B: SMALL CANDLE BODY WITH RISING VOLUMES
In this example, the Volumes are extraordinarily high as compared to than the preceding volume bars. The candle is green and more importantly, the selling has been rejected and the close is closer to the high. This signifies that operators very heavily bought the stocks and perhaps retail got out or shorted.
A small candle body with solid volumes is a tell tale sign that something is about to give, and this is a signal that is independent of any indicator.
In this case, as you can see from the successive candles, the Yes Bank stock spurted from about 170 levels to 210+ in a matter of days.
You can apply this analysis to a bearish candle too for shorting.
C: SMALL CANDLE BODY WITH RISING VOLUMES (BEARISH EXAMPLE)
In this example, the Volumes are extraordinarily high as compared to than the preceding volume bars. The candle is red and more importantly, the buying has been rejected and the close is right near the low. This signifies that operators have very heavily sold the stock and perhaps retail got in and are trapped.
This is the candle of 25-1-19 (Friday) and as per VSA it is expected that the stock will witness selling action on 27-1-19 (Monday).

E & F: LARGE CANDLE BODY WITH LOW VOLUMES
A large candle body (bullish or bearish) with low or average volumes signifies that a big player is trying to game retail. However, there is no guarantee of that.
Therefore, you should always add 10 EMA to your VSA analysis specially while analyzing large candles with low volumes. In the example above, despite the low volumes, the stock has fallen (E) and risen (F), acting contrary to the theory.
Let us now add 10 EMA to the chart above and check the results:

Now, you can get a clearer picture. At (E) the price crossed below 10EMA and that was a signal not to buy the stock, contrary to VSA. At (F), the 10EMA signaled a buy despite the VSA suggesting average volumes.
CONCLUSION
Though VSA is an extremely powerful technique, it works even better when you use it with your favorite technical indicators. That way you get a double confirmation.
Read up all the links and the material above and practice it on charts to attain proficiency. Maintain an Excel sheet and enter your observations or paper trades and check the results after a month to gauge your success percentage.
One more thing: If you are an intra day trader, add VWAP to your setup for getting sharper signals.
As you keep practicing VSA, your chart reading will become sharper and your trading success % will increase over time.
C: SMALL CANDLE BODY WITH RISING VOLUMES (BEARISH EXAMPLE) – – – > here ut dhould be D.
Secondly can you tell me the difference between A, C and D. All have higher volumes, clisung at days low. Now it should be the same that next day stock opens lower and goes up?
Hearing this analysis for the first time and Well understood during the first read as it was well presented. Much appreciated!!!
Thank you so much for sharing the post.
THnaks regards.
Microsoft Access VBA programming
Sir, what we can interpret from hourly chart of MarashtraSeamless?
Hello Sir, very nice analysis…
Quick question on the HCL Tech Daily chart on 30th Jan,19, fits the bill with higher volumes above 10 day ema, open and close nearly the same but fell the next day….what would be the stop loss here please ? And are there any other indicators to be used further…Thanks
Typo error C: SMALL CANDLE BODY WITH RISING VOLUMES – you’re explaining D here
Sir, I just started to check the chart of LT Foods .
Weekly Chart —->Giving Bullish sign
1] EMA not Cross .
2] MACD Showing Bullish.
3] BB Range is 46.76 not touch
1 day Chart —->Giving Bearish sign
1] EMA Cross .
2] MACD Showing Bearish.
3] BB touch 41.60
Will LT Foods become bullish as per weekly chart ?
I just started to learn/Practice chart from your article.