This setup is for beginners who would like to get clued on to the correct market direction.
That said, beginners or experts, profits are profits. So, you can try this out even if you’re a pro.
Before you use this setup, know that it works best for the Indices (Nifty, Bank Nifty, etc.). It also can work for individual stocks, and you should experiment with it.
Here’s a step by step guide:
- Register for free at Investing.com
- Search for any stock, or for NSEI, which represents the Nifty Index. I have used the Nifty in this example and all that I write here, represents actual trades. View this image and let’s move to the next step.
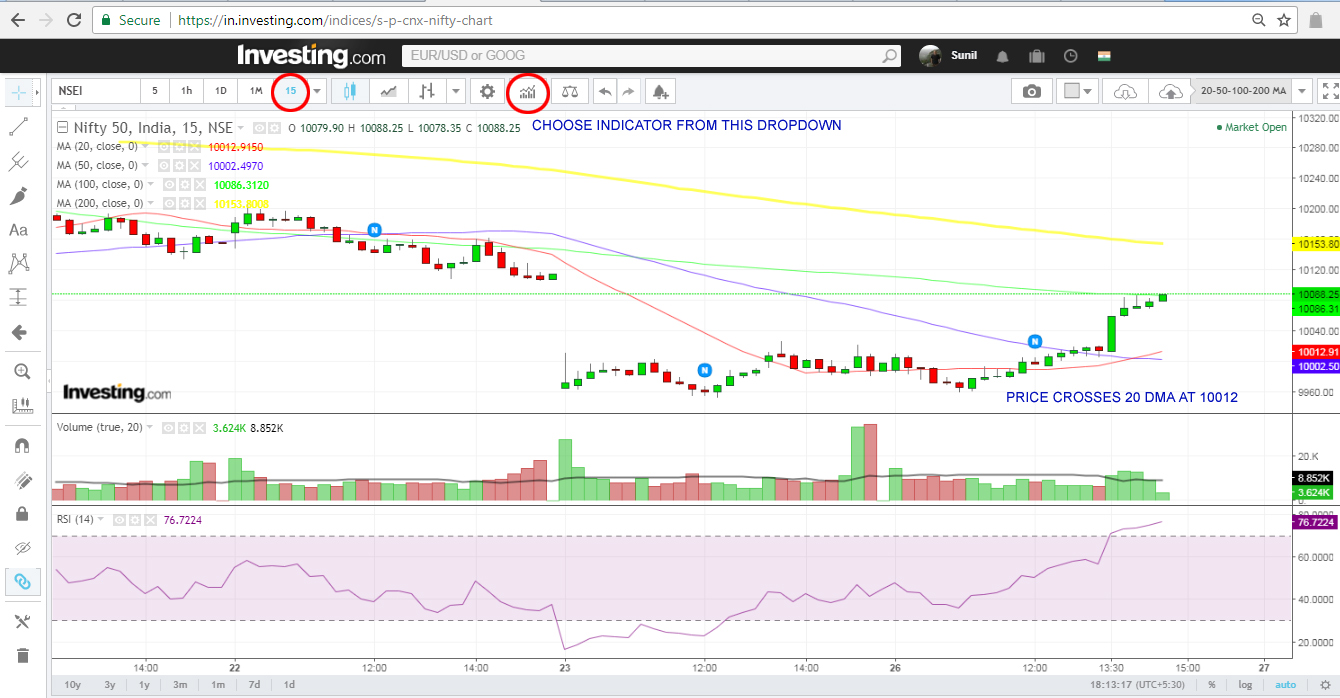
- Now add the following indicators:
a. 20 Day Moving Average
b. 50 Day Moving Average
c. 100 Day Moving Average
d. 200 Day Moving Average
(you will have to repeatedly click on the Moving Average indicator and then set the periods and the line colours)
e. Add the RSI (the default is set to 14 Days, which is cool) - Now register for free at TradingView.com – know that Trading View delivers delayed data to free accounts but as the trade setup suggested here lasts at least 45 minutes to 2 hours, the delay does not matter as much.
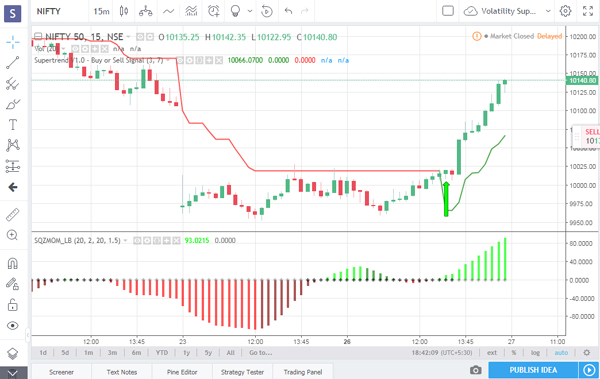
Now check this image out:
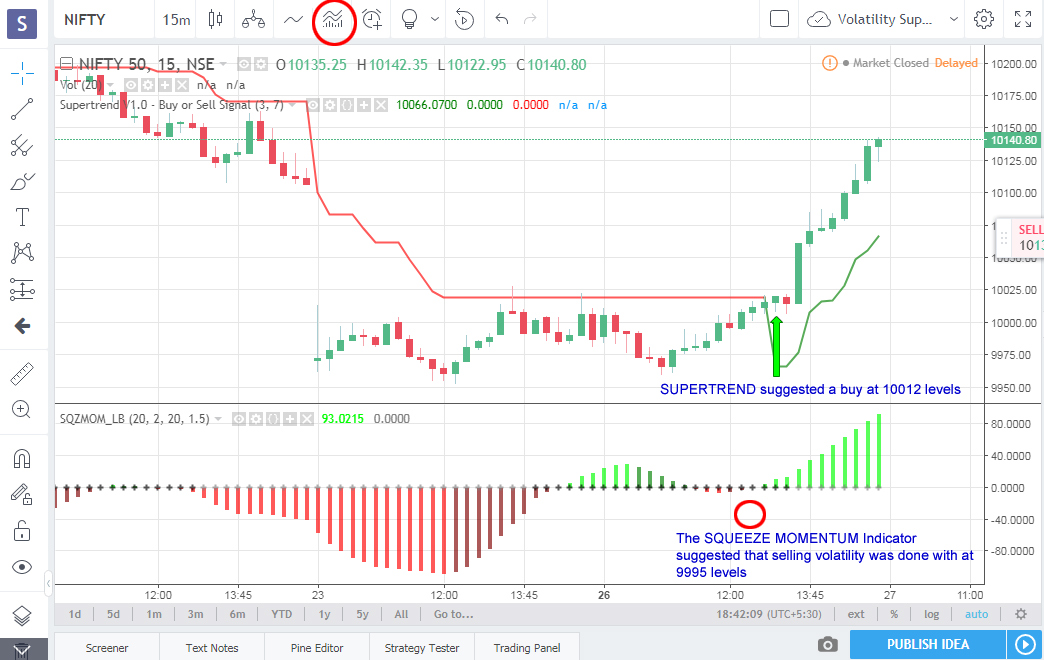
- Open the Nifty Index chart and set up the following indicators (icon circled in red)
a. Supertrend
b. Squeeze Momentum Indicator (You’ll find this under the same icon in the Public Libraries). - Now add one more indicator – Ultimate Moving Average – Multiple Time Frames (CM_Ultimate_MA-MTF)
Right, we’re all set up.
UNDERSTANDING THE INDICATORS
Moving Averages are the average of the stock price for a certain period (20-day, 50-day, etc.)
RSI is a momentum indicator. Anything over 70-80 indicates overbought; anything below 30-20 indicates oversold. In between the trend keeps moving up or down per price movement.
Supertrend uses ATR (Average True Range) calculations and places buy and sell pointers (arrows) on charts.
Squeeze Momentum Indicator calculates volatility of a stock. When volatility drops to 0 or near 0 levels, it implies that the stock is getting ready for an explosive move in any direction. Therefore to use the Squeeze Momentum Indicator, you must wait for a confirmation (the next formation) before taking a position. Or, if Supertrend or Untimate MA suggest a buy when volatility is down, you can act based on your risk appetite.
Ultimate Moving Average auto calculates MA swigs and signals a buy or a sell by turning green or red respectively. It overlays the main price chart,
Here’s how your Trading View chart should look after setup:

HOW TO TRADE WITH THIS SETUP (This was written before adding the Ultimate Moving Average indicator. Remember that this indicator will give you sharper signals than Supertrend (as you can see from the chart above) and then you can use Supertrend more as a confoirmatory signal)
- As the market was choppy, and the future uncertain, a decision was taken to focus on day trading.
- Accordingly, the candlestick time period was set to 15-minutes. Investors can play around with 1-Day or 1-week settings as well, while traders can also try out the 30-minute setup. My favorite is the 15 minute time intra day period.
- At about 11.45 AM, the Nifty spot price crossed the 20 DMA (at around 9995), indicating bullishness. At the same time the RSI also started moving up from 45 levels.
- Interestingly, at around 12 PM, the Squeeze Momentum Indicator displayed volatility at its lowest (near 0), indicating something big was about to happen. The next 2 bars confirmed a bullish trend for the day.
- The Supertrend indicator threw up a buy signal at around 12.45 PM, when Nifty was 10015. All systems were a go then.
- Now, at 11.45 the Nifty 10000 28 April CE was available at 48; and between 12.30 and 12.45 PM, it was available at 60 and 73 respectively. It was snapped up at all levels (48, 60, 73).
- The Nifty started spiking and the 10000 CE hit about 117 resulting in handsome gains.
Well, this setup works for me and it should work for you as well. Try it, but do not trade for real until you are comfortable with it (it will take 4-5 days). Also, do not be rash. Watch the news, technicals, etc., before attempting any trades and always work with a SL. Good luck.
Great article sunil
Amazing and nicely explained…. loved it
Currently i have zero knowledge about chart analysis, Can you please also start blogging from basics..The UI looks cool.
super Mr Sunil. As u said i will observe and follow. Thanks a lot
I am new to this but it looks interesting. Looking forward to more articles. Thanks
Nice setup
Will try it…
Thanks for sharing such strategy…
Dear Sunil Jee Greetings,
Thanks for the chart setup. I got registered with Investing.com and tried to set up i could find MA and other indicators but not Supertrend & Squeeze Momentum Indicator (You’ll find this under the same icon in the Public Libraries). Pls advice.
Thanks
Sundar
You need a free account TradingView.com for that. Please read the article again.
Thank you jee. I got it.
Great job sir..
Sir your setup was working very nicely I managed to end up with profit today. Thanks for the additional indicator. this is very useful to study nifty direction. Thanks a lot.
In tradingview candle chart, how to read the candles? Some candles green, green with red border,red with green border, blue, black. even though this not important in this setup, I would like to know. Thanks
I have a doubt that when we hav to enter and what will be the target and stoploss
Do it works on stocks also
For stocks use 1 Day candles for positional trades and work only with FNO stocks.
Ichimoku cloud gives you the stop loss levels.
Supertrend tells you when to enter.
Awesome sirji…. thanks alot…
Hi SIr,
CM_Ultimate_MA-MTF
super trend and squeeze momentum indicator is free to use. I don’t see them in trending view.
Could you please tell how you added these indicators?
Look harder
Sir ji,
Sorry for this — Expecting everything for Free..
But, to ADD the Squeeze Momentum indicator and Ultimate MA-MTF Indicators — WE are being DIRECTED to go for the PAID version — suggesting that ONLY 3 indicators are ALLOWED(though I’ve ADDED ONLY the SUPER-TREND indicator) NOT only Vishal, I have been encountering the same issue..!!
Shall be glad if you can clarify..!!
Use this setup. It’s live and free: https://bullbull.in/charts/a-live-trade-setup-that-can-generate-super-profits/
Hi Sir , can you please share your view on Shri Keshav cements and infra. How is this company fundamentally.
Thank you very much
Solid stock for the long term
Thank You Sir!!!
Sir, for all setups kindly explain the stop loss strategy also. Thanq.
Sir, for a positional trading, what would be the moving average values you suggests?
Sir, thanks for all these articles. Can you please let us know which has been been top 3 profitable trade set up for intraday.