What this strategy does: It allows you to get in and out of swing trades and possibly convert your longs or shorts into a medium term trade thereby allowing you to become a specialist in a few stocks.
Remember this – if you specialize in a few stocks, you can maximize your profits. Your domain knowledge in the selected stocks increases and as you keep applying different trading strategies to such stocks, your knowledge of how indicators work increases.
So, this strategy not only helps you make profits in the swing-medium term, it also increases your chart reading expertise.
ONE: INDICATORS, PERIODS AND PATTERNS YOU NEED
You should monitor the 1 DAY period for robust and reliable indications
EMA (5, 10): I have chosen 5,10 because it compares the average movement of one week with the movement of two weeks (5 trading days = one week).
The 10 EMA is also considered very important. Many traders regard the trend as bullish if the price is above the 10 EMA, and vice versa.
As far as patterns go, all you need to know is how to draw a straight line on the charts, that’s it.
Plus, you need to monitor Volumes.
The EMA crosses can be used for a swing trade while the resistance crossovers can be considered for a medium term trade.
TWO: SCREENERS YOU NEED
Set up 2 screeners at any site of your choice:
5 EMA crossed above 10 EMA
5 EMA crossed below 10 EMA
THREE: HOW TO WORK THIS STRATEGY
Example 1:

(a) On 5-6-18, Berger’s Paint 5 EMA crossed below the 10 EMA and the stock fell to 279. Going back in time, a swing-medium term trader must draw a straight line at the top of the candle and keep watching for the price to convincingly cross above this line (we’ll call it Resistance Line).
(b) At this point the price crossed the resistance line convincingly but fell the next day. It this trade was taken, it would have triggered a SL.
(c) and (d) At these points the 5 EMA crossed above the 10 EMA and the price crossed above the resistance line. It was a signal to go long again. This time it worked. The crossover happened on 5-7-18 and today on 23-7-18, Berger Paints is at 310, after hitting a high of 320.
Example 2:

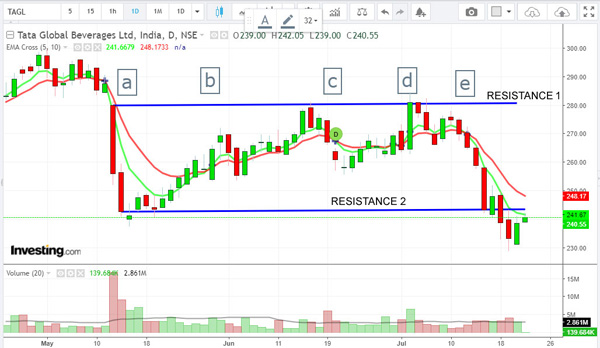
(a) On 14-5-18, Tata Global crashed from 280 to 255. The 5 EMA crossed below the 10 EMA and a sell signal was generated at around 265.
The swing trader, as per this strategy, must draw a line of resistance at 280 and keep monitoring the price. Additionally, they also can set up alerts.
(b), (c) and (d) These points represent EMA crossovers, but none was substantial enough to push the price above the line of resistance. But the crossovers were good enough fodder for swing traders who could have played the stock between 255 and 280.
(e) At this point the 5 EMA severely breached the 10 EMA and raced downhill taking the stock all the way down to 230 levels. This EMA crossover provided an opportunity for swing traders to short the stock.
As on today, 23-7-18. the Tata Global stock is at 237:

At this point we can draw another line of resistance (at 242) which enjoins 2 candles.
From now on the strategy in Tata Global would be to
(a) Wait for it to cross 242 (whenever that happens) for a play up to 280 so long the EMA crossover justifies it
(b) Wait for it to cross 280 to enter into a medium term trade.
Will this happen?
Who knows!
As traders it is our job to set alerts and act based on what our eyes tell us, not what our mind suggests.
Remember this before putting this into practice:
If the stock falls then the resistance line should be drawn at the candle top
If the stock rises then the support line should be drawn at the candle bottom
So, go ahead and try this strategy out on paper trades with a few stocks and see how it works out. Set up your screeners and choose 3-4 stocks to work with.
You will find that over time you are easily able to better understand how each chosen stock ticks and how charts work.
understood about the crossover but couldnt understand where to draw resistance line.
If the stock falls then the resistance line should be drawn at the candle top
If the stock rises then the support line should be drawn at the candle bottom
is the trading system allow to short the stocks more than one day under normal trading ? ( not under Futures )
It may or may not work. Intraday is safer.
Nise and informative for new learner. Good work .thank you.
SIR I HAVE TRADED WITH YOUR CHART IDEAS .ITS WONDERFUL AND FANTASTIC.IT REALLY WORKS.THANK U SIR.HOPING FOR MORE IDEAS.THE BEST PART OF YOUR IDEAS IS THAT THEY ARE SIMPLY EXPLAINED BEAUTIFULLY.NO PROBLEM.
SIR HOW CAN WE GET FIBBONACCI CALCULATION ON CHARTS.PLZ SHARE IF POSSIBLE.
can u explain the use of volumes?
Thanks for writing this article i was long searching form articles like this that would contains such nice information and ideas.
Thank you Sir for this excellent post. Will it work on 1 hr/ 4 hr time frame also?
Test it out. I wrote what I tested out.
Hi Sir, I have below 2 queries
1) In your earlier post you had showed EMA and in this EMA Cross. is there any real difference between the 2 indicators?
2) When you mentioned swing trade in this post, does it mean only for INTRADAY?
Bpth are same. EMA cross is 2 EMAs rolled into one. For example 10 and 20 – when they cross, it shows. The standalone EMA has just one indicator. Measurement is same
Article at the start says ” For Medium swing trades” , but you recommend it to apply in intraday in the comment section. Puzzled.
The line pattern is t determine length of trade – mostly swing
The EMA crossovers can be used for getting in and out of trades. Swing trade can range from 1 day to a few weeks.
SIR, CAN YOU PREPARE LIKE PDF FORMAT OR WORD PAGE FORMAT TO TAKE PRINT OR KEEP IN LIBRARY TO BETTER TO READ LIKE A BOOK…. ITS MY PERSONAL FEELING.. THINK IT SIR….. U R GIVING AWESOME KNOWLEDGE TO US….