DATE: 9 DECEMBER 2017
A Golden Cross is formed when the 50 Day Moving Average crosses the 200 Day Moving Average.
In plain English for those who do not understand charts, it means that the medium term (faster) average price of the stock has crossed its long term (slower) average.
It’s an extremely bullish signal but many investors and traders make the mistake of using it in the short term.
The Golden Cross is usually a long term signal, BUT can even work out in the short run.
How to Use the Golden Cross Signal?
STEP ONE: Open BullBull and select Golden Cross on the Chartbot page (Home Page).
STEP TWO: Check the list of stocks discovered. I got this list today.

STEP THREE: You must now check the stock’s fundamentals and announcements. If the AR makes for good reading or if there is some announcement that is positive, it means someone in the know or some HNI is buying the stock.
If the company is fundamentally good, and if the news is positive, you can consider an investment. If the company appears shady, and if the fundamentals do not justify the market price, just ignore the stock.
STEP FOUR: The next thing to check is the space between the 50- and 200-DMAs. Check this image that I have borrowed from an online site:
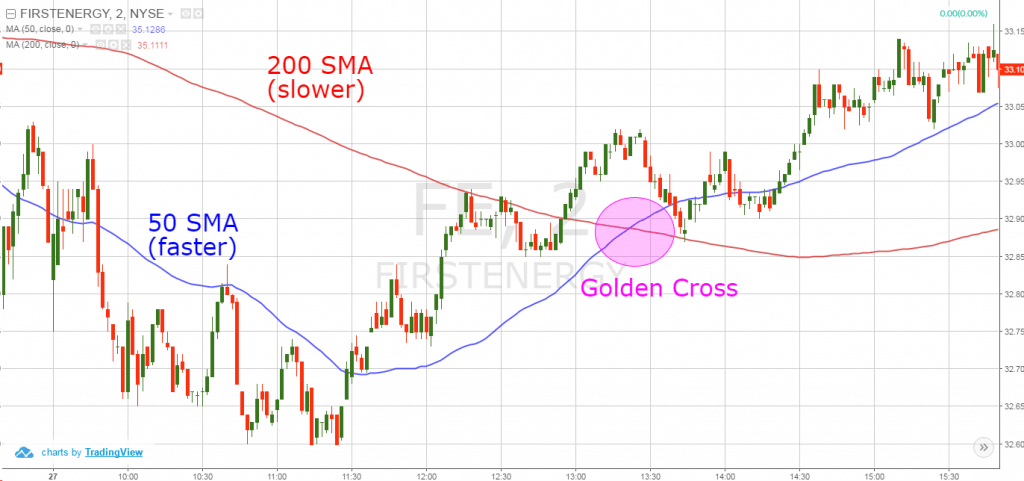
In this chart, the gap between the 50-DMA and 200-DMA is fairly significant. Also note that though the price dipped initially, it shot up subsequently.
Now, when the gap between the 50- and 200-DMAs is fairly large, it could also mean that the opportunity is lost UNLESS the fundamentals or announcements justify an investment.
The chartist in this case has used it for a day trade — BUT KNOW THAT THE GOLDEN CROSS CAN WORK SHORT-LONG TERM, MOSTLY FOR LONG TERM.
STEP FIVE: Now let’s examine a case where the 50 DMA has just crossed the 200 DMA. This is more exciting because in such a case, the stock’s journey may have just started.
I chose Himmatsingka Seide from the list because I know that there’s a lot of fund action happening as per Inside Deals reported by the exchanges, which I update on my blog daily.
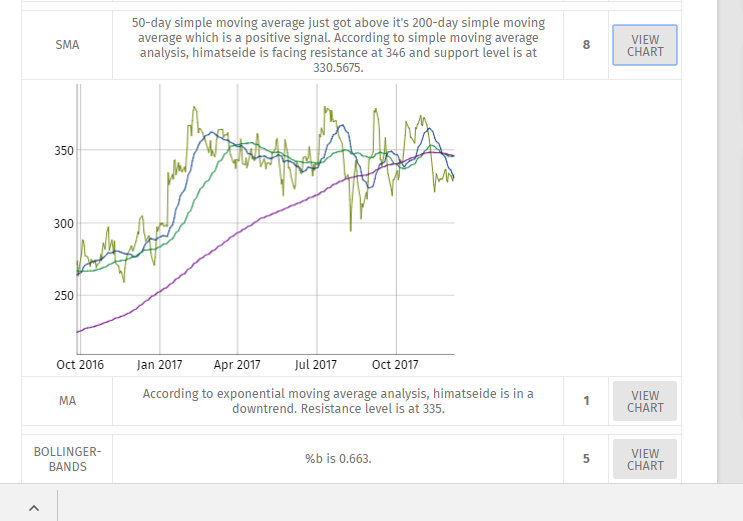
I checked the yearly high-low which were 400-266 and with the CMP being 333, I found the stock worth tracking. If it were a stock like Graphite India which has appreciated 1000% in one ear, I would ignore it.
The next item were to check what the other indicators reported at the BullBull Chartbot tool.
Well, the other indicators were just below average but the thing I learned was that the SL was 313 and the resistance was 335-341.
Therefore, based on this information, I found Himatsingka Seide was worth tracking and maybe also good for a short term ride if it crossed it’s resistance levels. Of course, in this case too one has to check the fundamentals and the news before making any investment decision.
In some cases it is possible that the 50-DMA has pierced the 200-DMA because of WhatsApp/SMS/Magazine posts. Therefore it always makes sense to check what other indicators are signalling, and what the fundamentals are telling.
To sum up, this is how you use the Golden Cross indicator at BullBull.in.
I’ll blog about other indicators and combos soon.
Well explained!!!!
Well explained
Great explanation sir …..
good explanation, what are the other indicators that you use to check along with this
No other indicators. Just the Golden Cross to learn stocks that have mega potential. Of course, you always should study fundamentals and news before buying.
Well explained. Need to know more parameters for identification of long term multibagger stocks.
I want to improve my technical skills.
Two books uploaded — these can help immensely: https://bullbull.in/SHOP/