
You may be following chart signals generated by 15m, 30m, 1H, 1D charts for intraday or swing trading, but are you sure that the signal generated by your chart is not a false positive/negative?
This guide will help you tell with a large degree of certainty that the trade you are about to enter into has a good chance of succeeding.
Before you start, please read our trade setup that can help you generate profits.
I’m writing this post in response to a query on “why Shankara Building Products is falling?” on our Mumbai Whatsapp group.
I started analyzing the stock and was surprised to see that our trade setup had generated a sell call at 1830.
But that got me thinking.
If our trade setup generates a sell or a buy call for a particular period (minutes, hours, day or week), what should a trader do to ensure that the signal has more chances of succeeding than failing.
This post will help you ensure just that.
So, after you identify a stock, here is what you should do:
FOR SWING-SHORT-MEDIUM TERM HOLDING, THE ORDER THAT YOU SHOULD CHECK CHARTS IS
a. 1-Hour Chart
b. 1-Day Chart
c. 1-Week Chart
But the significance of each time period is explained in reverse order for better understanding.
STEP 1: LOOK AT THE WEEKLY CHART FOR THE BIG PICTURE
The weekly charts present the big picture that generally holds good for the medium term. This is the first chart you must check to know the general trend.
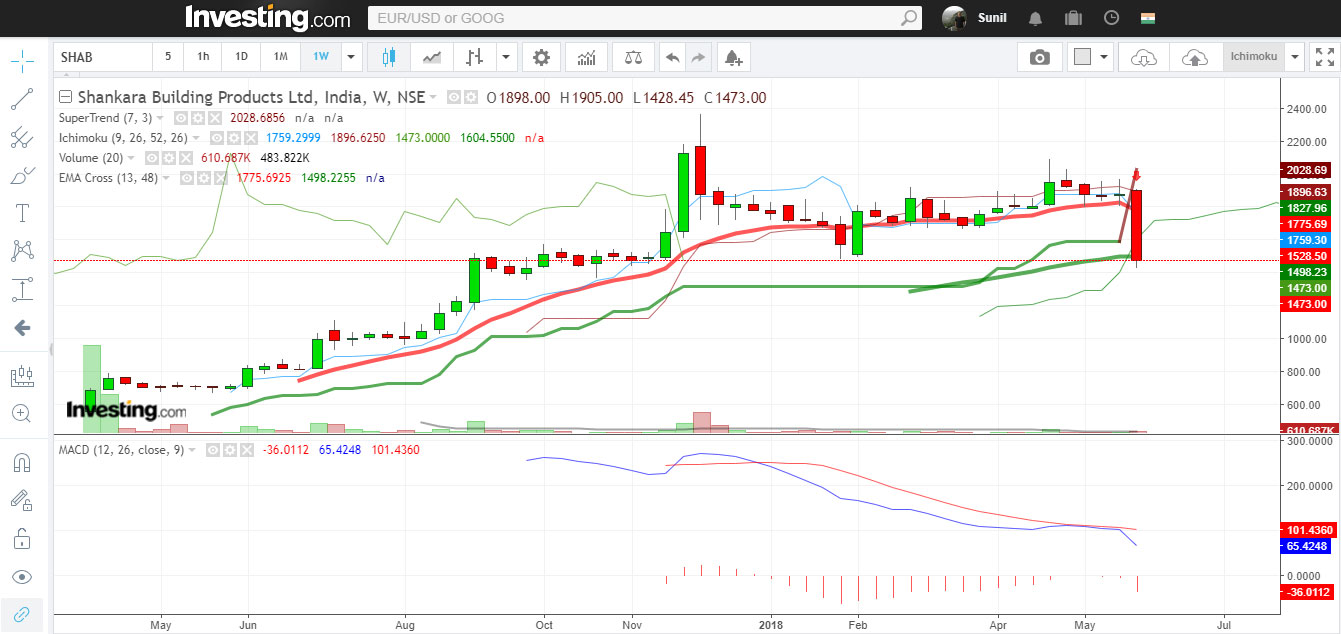
The analysis, if you have read our trade setup, is easy:
- Shankara Building Products was in an uptrend but it broke this week – actually today (31 May 2018).
- ST signaled a downtrend
- Price fell below Ichimoku and 13D and 48D EMAs.
- The MACD line fell below the Signal line above the Zero line which is another bearish signal.
Now, the trader will ask that the trade setup gave a sell signal on the most crucial day (31 May 2018), and therefore what use if the trade setup.
Right, let’s now move to the 1 day charts of the same stock.
STEP 2: LOOK AT THE DAILY CHART FOR THE SHORT-TERM PICTURE
The DAILY charts present the short term picture and you must check this immediately after checking the big picture.

The analysis:
- ST signaled a downtrend today (31-5-18)
- Price fell below Ichimoku cloud supports and the 13D and 48D EMAs. The Ichimoku cloud is also turning red.
- The MACD line fell below the Signal line above the Zero line when the stock was 1890. The interpretation is that the MACD crossover should be considered as an alert, but maybe not a full blown trade signal because at that time there was no confirmation by other indicators.
Right, let’s now move to the 1 Hour charts of the same stock, WHICH ARE USED TO DECIDE WHETHER TO ENTER INTO A TRADE.
STEP 3: LOOK AT THE HOURLY CHART TO DETERMINE WHETHER YOU SHOULD ENTER INTO A TRADE
The HOURLY chart signals should be used to enter into a trade present the short term picture and you must check this immediately after checking the big picture.
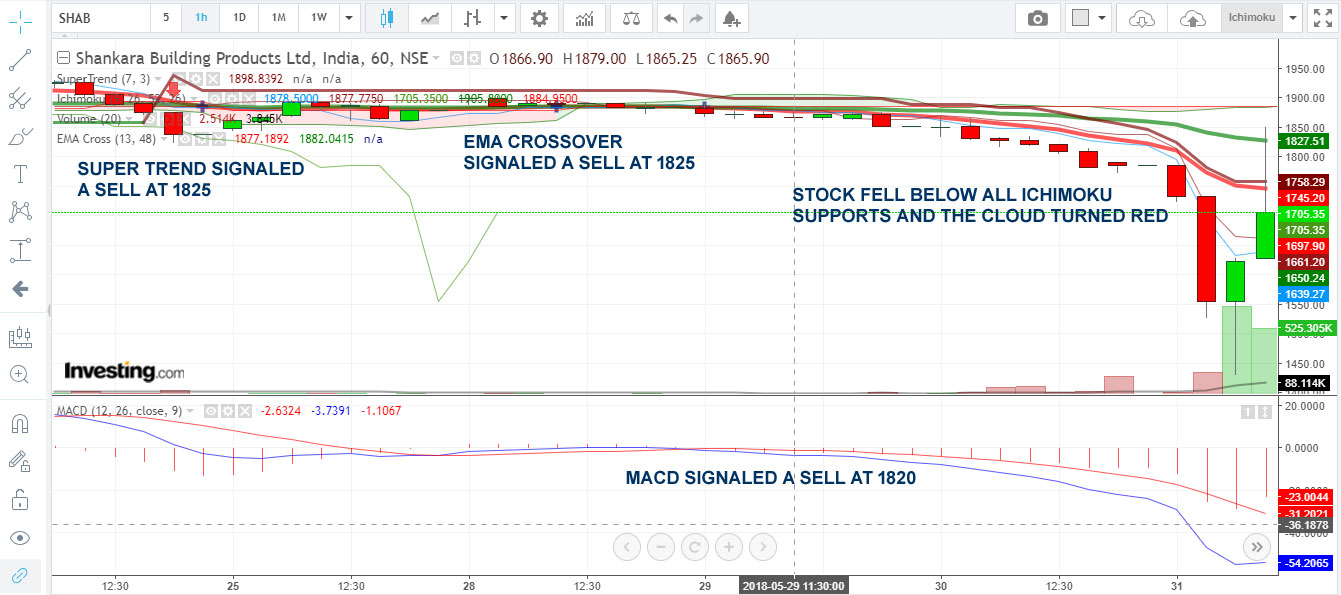
The analysis:
- ST, EMA and MACD signaled a sell at 1825 on 24-5-18.
- Price fell below Ichimoku cloud supports and the 13D and 48D EMAs on 25 and 26 May 2018. The Ichimoku cloud also turned red.
- The MACD signaled a sell around 1820 on 25-5-18.
NOW LET’S READ THE CHARTS IN REVERSE ORDER:
- On 24-5-18 the 1 Hour charts signaled a SELL. This was confirmed on 25th and 26th.
- Going back, the 1Day MACD signaled a sell on the charts at 1890. The price also started breaking the 13 Day EMA on 25-5-18.
- On the weekly charts, before 31-5-18, Shankara Buildcon was in an uptrend.
THEREFORE, at best, in the period between 24-5-18 and 30-5-18, Shankara Buildcon made for a STBT candidate because the weekly chart was in an uptrend.
However, if you held the stock, all the signals said that you should book profits at least on 24-5-18 when the price was 1820.
At the time of writing this article, Shankara Buildcon is at 1697 after having tested 1427. Had you sold at 1820 per our trade setup, you would have made anywhere between 130 and 400 bucks a share within 7 days.
If at the end of the day (today on 31-5-18) the weekly chart reverses the downtrend, you can always change your strategy.
And this is exactly what happened. Check the chart. The weekly period reversed from the downtrend:
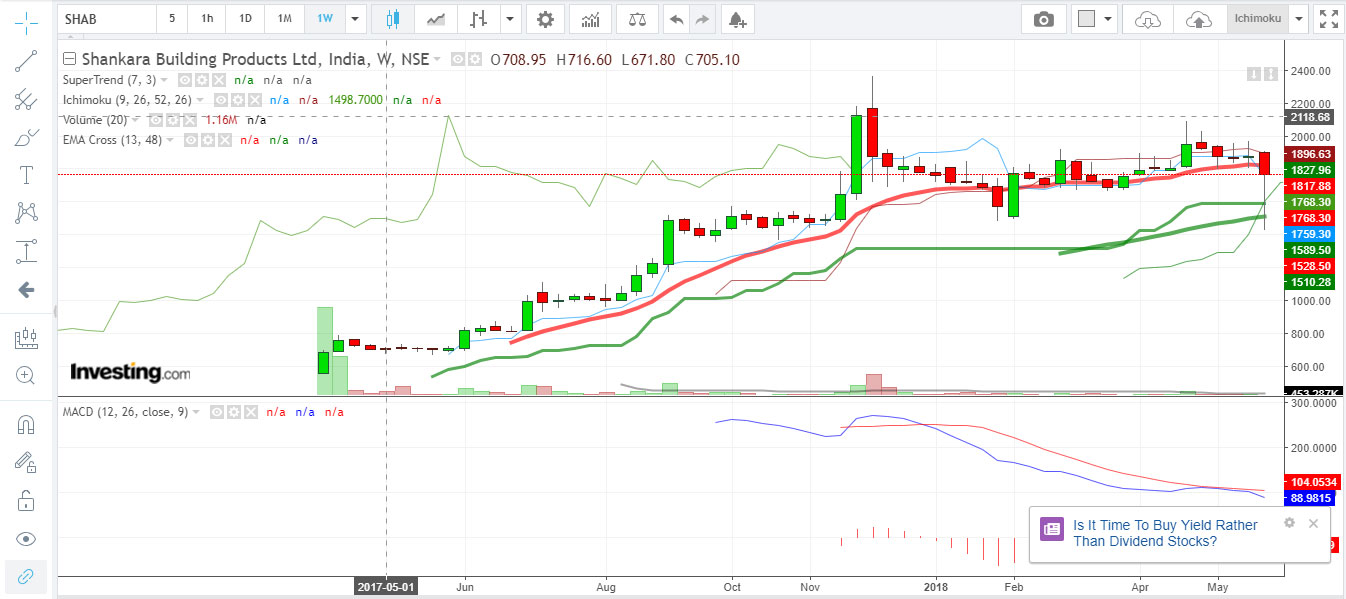
This is how you check chart periods and determine if a stock is good enough for a trade.
UPDATE ON 27 JUNE 2018
While trading for swing-to-medium term, it also pays to look at shorter time periods (lower than 1 hour).
Sometimes a trend remains static on longer period charts but starts changing on shorter period charts, and then by the time it hits the longer period charts, price action would have already started.
Therefore, do not disregard any time period.
If you are an intra day or swing player, check the longer period charts to know of the short-medium term trends.
If you are a short or medium term player keep checking the shorter periods to figure out if the short term trends are changing.
Practice this technique for a month or so, and you will be able to read charts and predict trends like a pro.
What about ADX indicator..is it equally useful?
Yes it is. Will blog that too.
Do you have Delhi WhatsApp Group?
I would like to be part of that
Not yet, but soon
Sir,
Nice article from your stable, can i request your input on how to select a stock for short term gain say 1 month or three months time frame from holding perspective, you may include F&O stock also in this. many thanks in advance.
Sir, Instead of WA, pl start a Telegram channel… 5000+ people can be added
sunil sir.is there any good software you recommend for live market tarde analysis …?
Could you please include me in your Mumbai group.
Hi
Sir suggest any other indicator replace ichimoku