
The following strategy has been tested for about a week now and it has proved successful 8/10 times.
It will help you discover trending stocks, analyze their charts and then enter into an intraday trade that can hold good for the very short term to up to 6 weeks.
Let’s start:
A: SET UP A SCREENER
I use Chartink, but you can use any screener of your choice.
The criteria used is a variant of the Golden Cross that many traders follow.
The Screener I have set up triggers a call when the 13 Day EMA crosses above the 48 Day EMA.
Yes, it is a very simple screener because the thorough analysis is done on the charts.
B. SIGNAL VALIDITY
The signal holds good mostly for intraday trades but can work out for short term trades.
For example, I had tweeted about Godrej Consumer Products at 1103 a few days back and L& T (1360)/Indian Hotels (141)/BSE (832) a day ago. All these stocks were discovered using this scanner along with reading OI data.
Track Godrej Consumer Products tomorrow on the charts.. it is likely that it will break resistance if markets are steady or up. The chart is #3 out of 4 charts. pic.twitter.com/OuIliLiEjp
— Sunil Tinani (@TheBullBull) May 23, 2018
Track L&T, BSE, Indian Hotels on charts using our trade setuphttps://t.co/6j6csgqo1z
— Sunil Tinani (@TheBullBull) May 28, 2018
On 29-5-18: Godrej Consumer hit 1143 , L&T jumped to 1420, Indian Hotels 148 and BSE continues to languish.
If you see profits intra day, you should book. If you are carrying your position forward, you must work with strict stop losses.
Note that in some cases the signal can hold good even for the medium and long term, but that will hold true for 2 out of 10 stocks. Therefore, it is best to use it for intraday trades extending it to a short term trade only if you are 100% convinced.
C. WHAT TIME TO START SCREENING
You can start at 9.20 to 9.30 AM to catch early trends.
I scanned at 9.20 AM and got the following stocks:
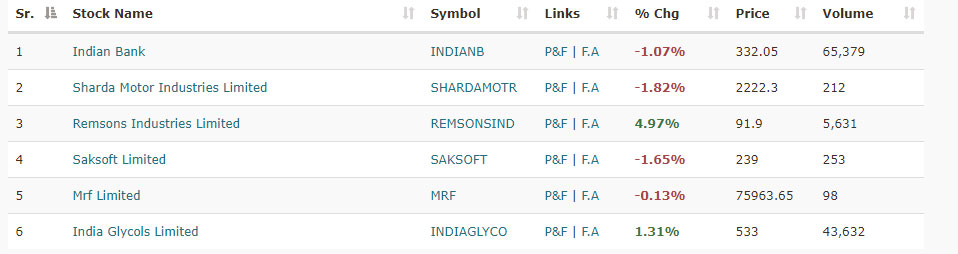
Out of the stocks screened, 4 were down and Remsons had hit the UC, leaving us with India Glycols.
I tweeted about the stock just to keep track:
Track (watch on charts or do a paper trade)
India Glycols
— Sunil Tinani (@TheBullBull) May 29, 2018
At 9.30 AM I ran another scan and got the following trends:
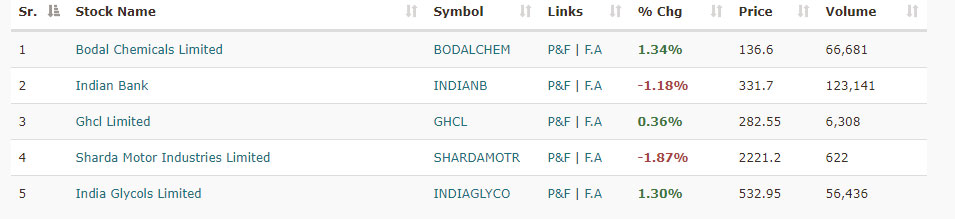
So at 9.30 AM, I now have 3 stocks to track:
India Glycols, Bodal Chemicals and to a lesser extent GHCL. This is because the volumes in GHCL are not significant enough.
Armed with this information let’s do a chart check:
D. CHART CHECK
We should do three checks:
One Hour – To determine if the stock is a buy
One Day – to determine the short term trend
One Week – to determine the overall trend
Now before you check the charts, please read this article and set up the following indicators:
a. Supertrend
b. Ichimoku
c. MACD
Now, let’s analyze each pick per time period:
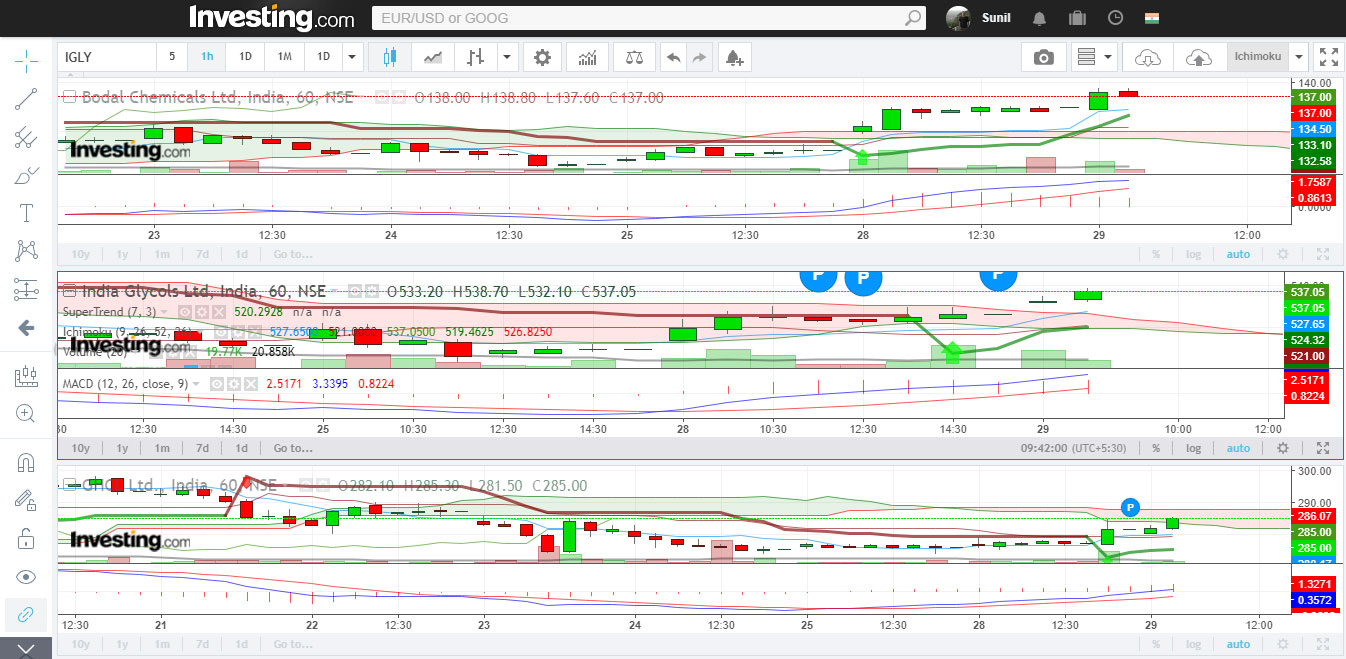
On the one hour charts, all three stocks are trending up and the ST has signaled a buy for all of them yesterday.
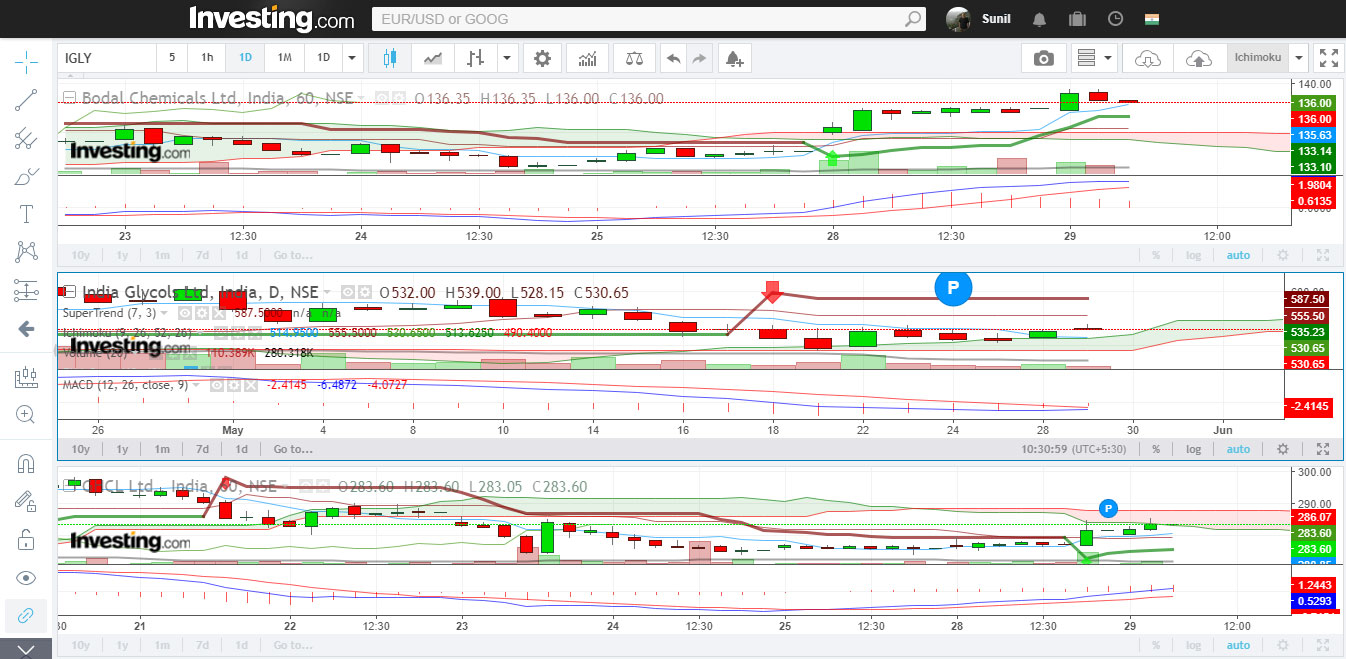
On the one day charts, Bodal and GHCL are a clear buy. India Glycols is a sell but if you look at the MACD indicator, you will see that the MACD line is about to cross the Signal Line from below the Zero Line, which if it does, it will be an extremely bullish signal.
Therefore, I would not consider India Glycols to be in a bear grip. Now let’s move on t the weekly charts.
You may want to read this article before analyzing the weekly period charts.
Since I can draw trendlines in my sleep, I don’t have to draw them here to know that all three stocks are in a medium-to-long-term uptrend. However you should draw trendlines for learning purposes.
So our chart analysis is good for all three stocks and
E. RESULTS (AT 11.18 AM)
Let us assume we took positions in all the three stocks at the rate we were alerted
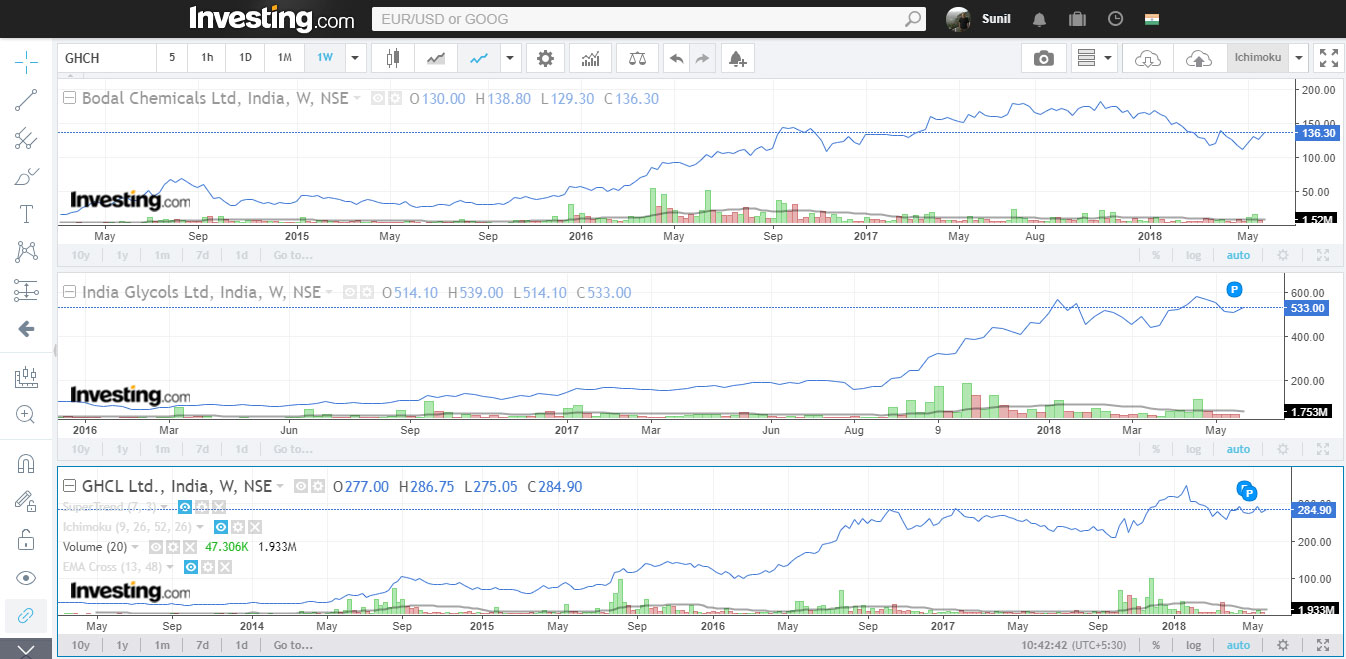
The alert for INDIA GLYCOLS was generated at 533 (see image above). It touched 541 and is currently at 532.
The alert for BODAL was generated at 136.60 (see image above). It touched 140 and is currently at 136.90.
The alert for GHCL was generated at 282.55 (see image above). It touched 287 and is currently at 284.50.
ALL THREE RESULTS GENERATED GAINS SO LONG PROFITS WERE BOOKED INTRA DAY!
This is why I have suggested quick entries and exits and preferably booking intra day gains even though the stocks look good for a short term hold based on their daily and weekly charts.
very good
this article is very informative sir,
one clarification regarding stock screening, like scanning was done to check if 13 ema > 48 ema, afterwards volumes have to checked before jumping to buy..can scanner help me to screen stocks for volume too,
Volumes are reported in the Screener results. Plus you can always check these in the charts
No Words to Say sir … the Perfect blog for traders
sir, when i run screener 13 day ema greater than 48 days ema on chartink, it shows 317 stocks. How your screener shows only 4 stocks. If I am wrong , please correct me.
It’s not “greater than,” it’s “crossed above.”
Hello Sunil,
Great. I have a question.
The Golden Cross scanner in chartlink is LatestSma(close,50)Crossed aboveLatestSma(close,200).
In your logic, is it this way? :
LatestEma(close,13)Crossed aboveLatestEma(close,48).
Can you please confirm that? thanks.
Yes, have said that too in the description
brlliant article sir for novices like me..where to put the stop loss Sir..
Use 10, 20, 50 EMAs as supports and stops based on your risk profile
Thank you Sunil Sir , This is very helpful… Just one query, whether the 13D and 48 D crossover should be looked into only daily timeframe or intraday like 1 hour chart will also work… I am new to this scanner, will this work in Live market ?
I haven’t tested other configs. Typically I watch for about 6-7 days before writing. You can try paper trade other configs and check
sir,question is… how to setup screener on chartink? i have some confusion.