Chartists regard pivots points are as support and resistance levels.
The logic being that if the price crosses above a pivot point, then it should continue rising. And, vice versa.
However, there is an X factor in pivot points. If it is ignored, then the whole concept of pivot points is useless.
The first step is knowing how to set pivot points after discovering a stock to trade in.
Let’s take the example of Nifty.
SETTING PIVOT POINTS FOR INTRA DAY TRADERS
Intraday traders typically trade on 5-Minute and 15-Minute periods and they should set pivot points based on
(a) Previous Day High, Low and Close
(b) High and Low of first 15 Minute candle of the day
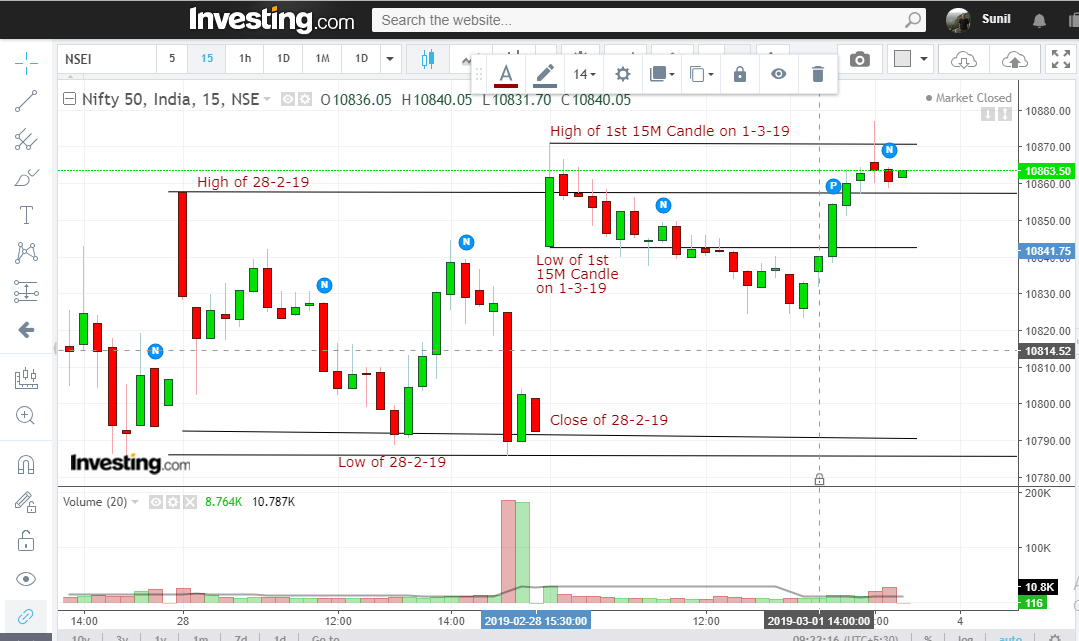
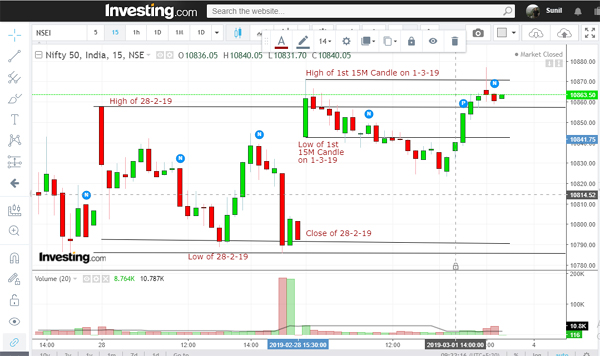
Let us assume we are trading on 1-3-19. From the chart above, here is our reading:
1. We drew pivot points on the High, Low and Close of 28-2-19
2. We drew pivot points on High and Low of 1st 15 Minute candle of 1-3-19.
3. Remember that the first 15 Minute Candle is a no trade because it is full of noisy traders.
4. Now we start our chart reading
5. The second 15 Minute Candle broke below the previous day’s high. It also broke below the high of the 1st 15 Minute Candle. This was a sell signal, but the volumes were poor.
6. After a couple of it pierced below the low of the first 15 Minute Candle. This too is a sell signal, but again the volumes were low.
7. Later it started rising, recovered lost ground, and broke above the high of the 1st 15 Minute Candle. Again, the volumes were poor. But the big thing was that the pivot points gave you meaningful signals without you having to rely on any technical indicators.
8. On days when the volumes are poor, it helps to add VWAP together with pivots. If you don’t know about VWAP, read this post.
Adding VWAP to the chart above would have helped us confirm the signals emitted by the price-pivot point movements.
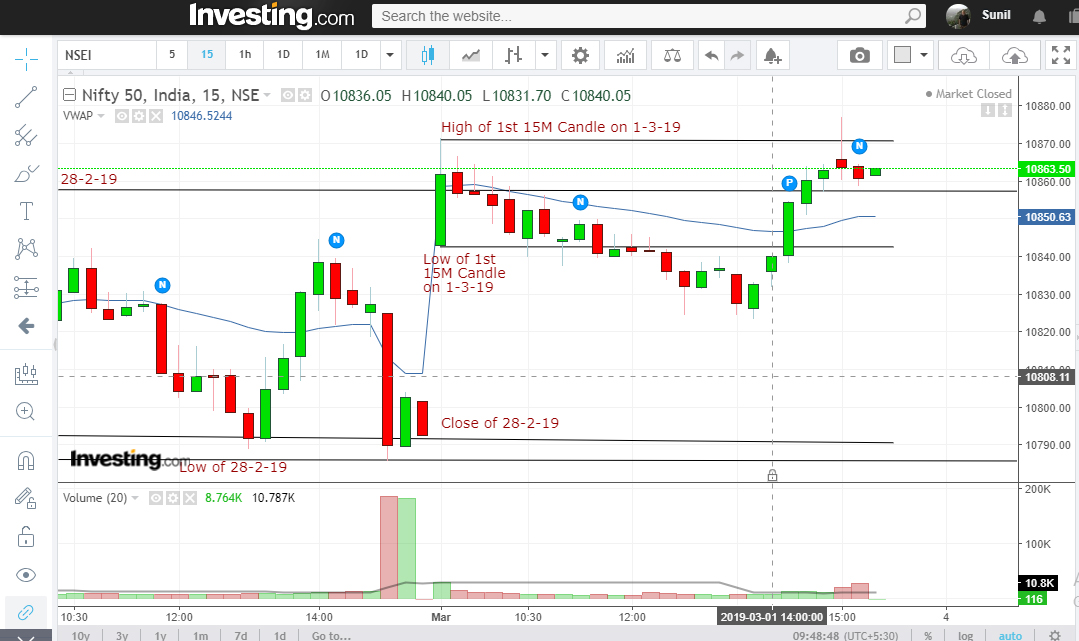
9. As you will observe VWAP confirmed the sell signal in the first instance, but was delayed in giving the buy signal wen the price started rising. When the price started rising, the pivot point alerted way in advance.
10. A word about Pivot Points – As stated above, pivot points work as support and resistance levels. When a support is broken, it becomes a resistance point, and when a resistance point is broken, it becomes a support. Apply this logic while reading charts.
11. You also can combine your pivot point reading with any technical indicator of your choice. That’s left to you. Typically, know that price action traders do not use indicators much.
So, if you use pivot points, Volume Spread Analysis and VWAP (on days when the volume is poor), your chart reading will become sharper and your success percentage will improve.
Try it out and leave feedback – whether this worked for you or didn’t.
Where have you set PP in this chart?
The HLCs that are marked as black lines are PPs