There are a few methods of telling a trend reversal on the charts.
Volume-Price analysis, Candle analysis, Support and Resistance breakouts and a couple others.
The following method is the one that I have tried and tested quite a few times and can vouch for its effectiveness.
Tools Required to Spot a Trend Reversal
1. Daily, Weekly and Monthly Charts
2. The ability to draw a trendline (Here’s some help)
3. 20 EMA, in case the trendline cannot be drawn or is inconclusive.
4. On Balance Volume Indicator.
What is On Balance Volume (OBV) Indicator?
It is not important to know the On Balance Volume (OBV) formula. It is more important to know how it works, and how to interpret it.
OBV alerts analysts on buying and selling pressure.
It adds volume to the previous OBV on up days and deducts volume from previous OBV on down days.
Here is how you interpret the OBV:
Price rises, OBV rises – Bullish
Price falls, OBV falls – Bearish
Price rises, OBV flat – Weak Bulls at play OR Indecisiveness
Price falls, OBV flat – Weak Bears at play OR Indecisiveness
Price rises, OBV falls – Informed Bears Shorting/Bulls Unloading (this situation typically occurs after 4-6 GREEN candles on the daily charts)
Price falls, OBV rises – Informed Bulls Buying/Bears Covering (this situation typically occurs after 4-6 RED candles on the daily charts)
Chartists typically are interested more in divergences between OBV and price when it comes to predicting trends.
Right now that you know what the OBV is all about, let’s move to the meat of the article.
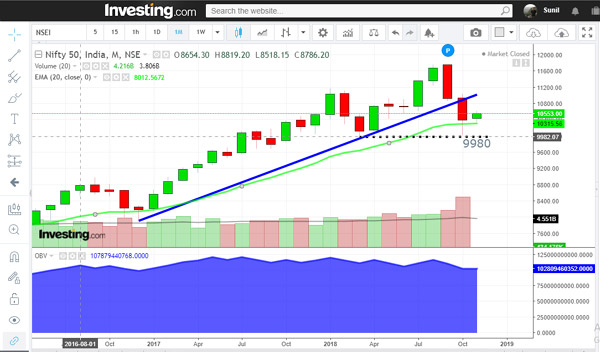
STEP 1: Analyzing Daily Charts
Nifty Price has broken out of the Daily trendline – The signal is Bullish. It implies that the trend of the last 39 days (39 candles before the breakout) may have reversed.
The OBV also has moved up, which is another bullish signal.
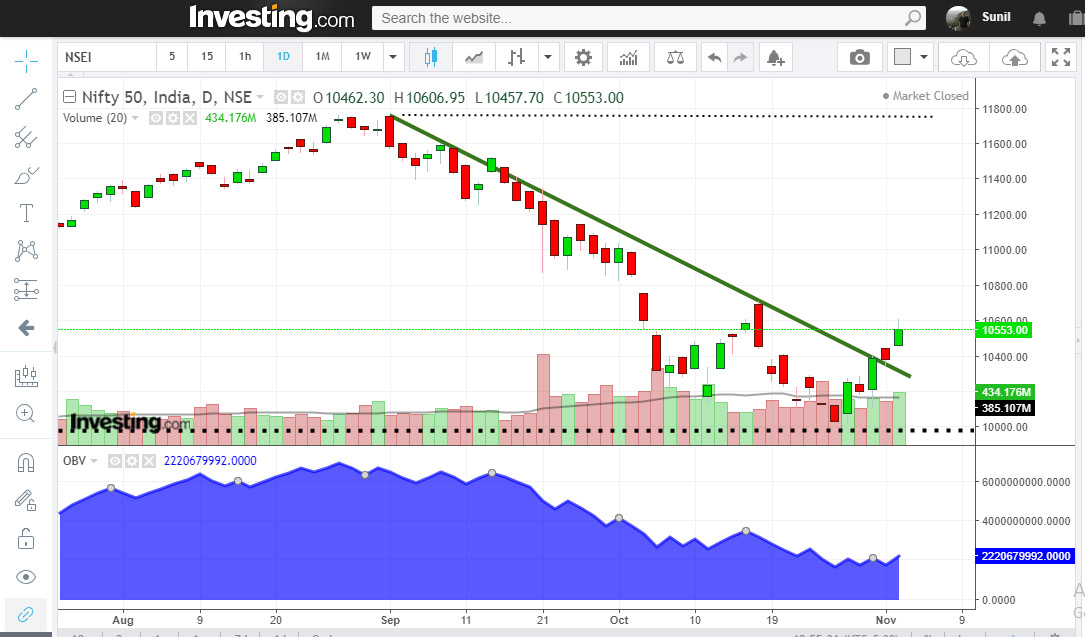
STEP 2: Analyzing Weekly Charts
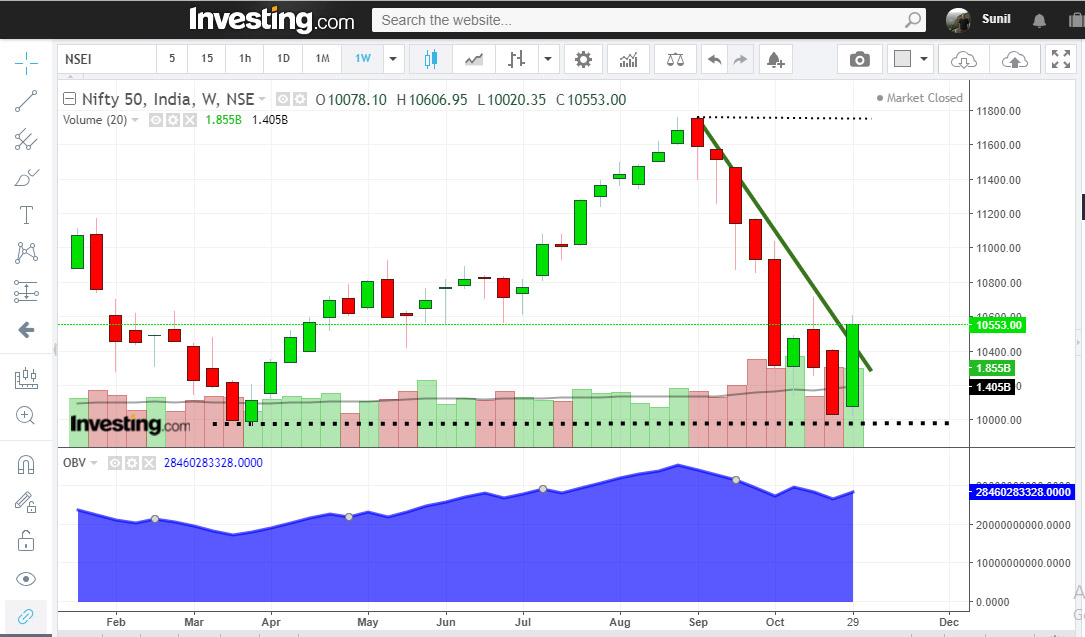
Nifty Price has broken out of the Weekly trendline – The signal is very Bullish because it implies that bulls picked up Nifty for the better part of the week. Note the wicks too, these are not very significant and the candle body has a wide range.
If it were compared 1-1 with the previous bearish candle, it would be considered a bullish engulfing candle.
The OBV also has moved up, yet another bullish signal.
If you count the candles prior to the last green candle, you will observe that 7 out of 8 candles were red and therefore we can say that the current bounce may be a short covering bounce that can retrace about 50% of the fall.
The Nifty fell from 11,800 to 10,000. That’s a fall of 1,800 points. So, for the movement, as on 4 November 2018, we can deduce that the Nifty has the potential to move up to 10,900.
STEP 2: Analyzing Monthly Charts

The monthly charts paint a different picture.
Nifty price is below the trendline.
The breakout point is interestingly at 10900-11000, which is where are expecting the Nifty to head to.
The OBV too has witnessed a minor uptick (monthly OBV typically does not witness steep swings, unless there’s a Black Swan or a Goldilocks moment).
As for the trend reversal on the monthy charts – it is not confirmed.
BUT…
The Nifty has moved above its 20 EMA, which is a bullish signal.
TREND REVERSAL ANALYSIS
The long term (monthly) charts hold promise because the Nifty monthly CMP has moved above the 20 EMA.
The daily and weekly charts suggest a trend reversal.
From the trader’s POV, Nifty has the potential to move up to 10,900 and therefore he should play with the trend with SLs appropriate for his trading style.
If Nifty does break 10900-11000, it then has the potential to move up to it’s previous high all-time.
This is how you should spot a trend reversal. There are other methods which I’ll blog as and when time permits.
Sir, one naive question. Indices are not traded directly, only it’s futures. Wrt the example given in the post, how can nifty 50 have OBV?
It’s the spot CMP.
nice read sir.
Sir does it work for all the stocks. Or any specific ie. f no or indices etc
Can any other ind support it instead obv like Rsi or Macp etc
How did we conclude that 50% retracement will be there?
It’s an estimate. All retracement probabilities are estimates.
Sir does it work for all the stocks. Or any specific ie.
https://vtrender.com/
Will work for FNO stocks and Indices
FNO stocks + indices
Nice read.
At 10900-11000,we will also get Right Shoulder on higher timeframe as part of H&S pattern.
Spot has no volume. Use future for charting OBV.
Futures charts do not give the accurate picture as each FNO contract expires at the end of the month. Moreover, an increased action in options and a lower degree of action in Futures can skew charts. Suggest you upgrade your knowledge.
Very nice. Really nice analysis. Thank you sir for your time in writing