
Relative Strength Index or RSI is one of the most popular indicators out there. Traders swear by it and in fact many of them are so happy with it, they do not use any other indicator.
RSI is calculated by measuring the ratio of upward-movements to downward-movements. The calculation is then further extrapolated and calculated in a range of 0-100.
Let’s not bother about the formula and focus on its interpretation.
The default period that RSI is set at is 14.
This means if you are watching the 1 Day chart, the default RSI represents 14 days, and if you are watching the 1 Hour charts, then the default RSI represents 14 hours, and so on.
The traditional method of interpreting the RSI is:
If RSI crosses 70, the stock is overbought (price rise exceeds market estimates). I would revise this to 75 given the volatile and disruptive nature of our markets. Plus, markets are now impacted by global factors. Conservative traders can tweak it to 80.
If RSI falls below 30, the stock is oversold (price fall is much more than market estimates). I would revise this to 25 given the volatile and disruptive nature of our markets. Conservative traders can tweak it to 20.
If the RSI stays above 50 for a long period of time, it implies the stock can perform for that period
If the RSI stays below 50 for a long period of time, it implies the stock can underperform for that period
Relative Strength Index (RSI) Trading Strategies
A. THE TRADITIONAL STRATEGY
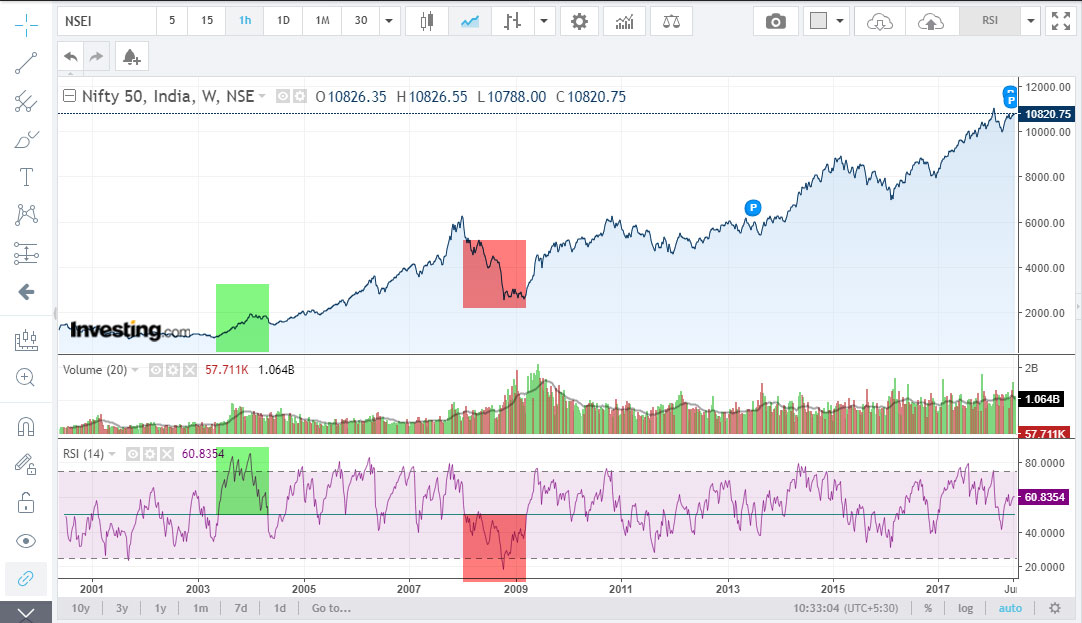
Soak in the chart above, don’t be in a hurry.
The RSI period are set at 75 (overbought) and 25 (oversold).
In addition, a line has been drawn at 50.
Observations:
-
Every time the RSI moves towards the 50 line from below and crosses it, the stock starts rising.
-
Till the time the RSI stays above 50, the stock remains in an uptrend.
-
Every time the RSI moves towards the 50 line from above and falls below it, the stock starts falling.
-
When the stock moves up from RSI 50 to RSI 75+, the intensity of the rise increases (check green boxes for an example).
-
When the stock falls from RSI 50 to RSI 25+, the intensity of the fall increases (check red boxes for an example).
-
By and large, the stock price reverses from 75 (it falls) and 25 (it bounces) levels.
-
Even when the stock crosses 75 on its way up, it reverses soon.
-
Even when the stock falls below 25 on its way down, it bounces back soon.
This is the traditional interpretation of RSI – okay, some modern elements are added.
The RSI on its own can give almost accurate signals to the trained eye.
Newbies can combine it with MACD for confirmation, but should know that RSI signals are faster than MACD’s.
B. SUPER RSI AND PRICE ACTION STRATEGY – WORKS FANTASTIC
For this you have to set up a simple screener, and I’ll show you how to. Don’t worry about it – it’s easy and you can create one in 5 minutes for free.
Before that, check this chart:
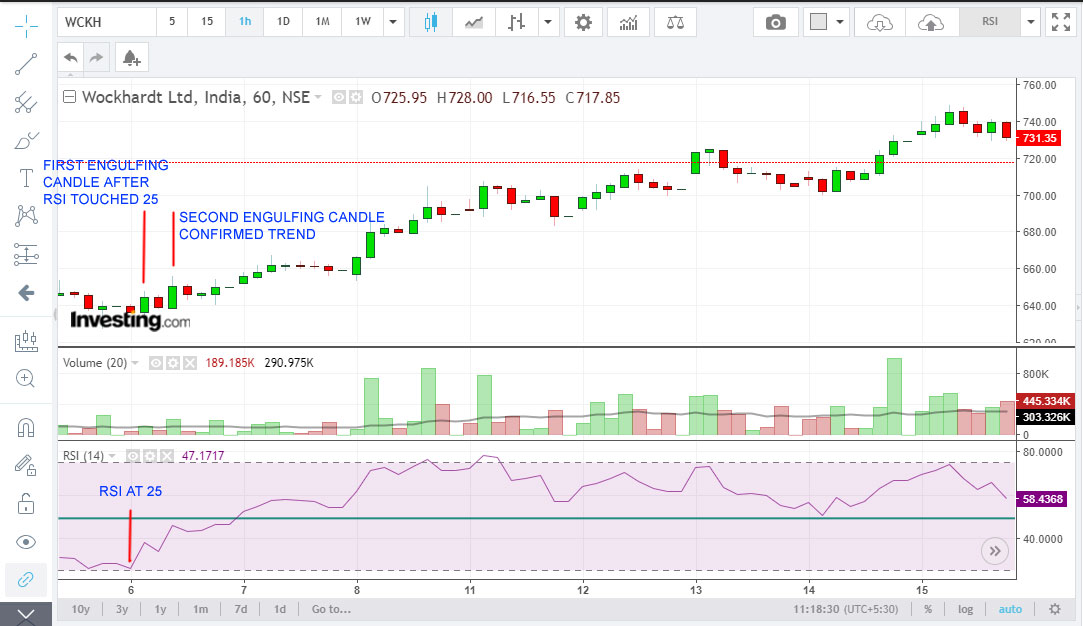
Here’s what to look for —
When RSI is below 30, and a bullish engulfing forms, it implies that the stock will head up. If you come across such a candle, you can take an intraday or BTST position.
If a second bullish engulfing candle forms, it implies the trend will continue (as you can see in this case).
Always check 1 Hour or 1 Day charts for this strategy because shorter periods can be misleading.
In the example above, Wockhardt’s bullish engulfing candles were formed when RSI was way below 30 and the price was about 650. Subsequently, the price hit 740.
Likewise, when RSI is above 70, you should look for bearish engulfing candles to enter into a short trade.
To latch on to this strategy, you should set up 2 screeners on Chartink.com:
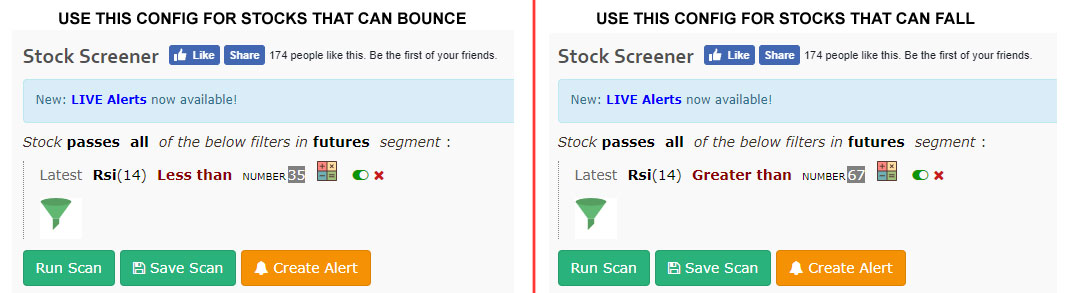
Now note that you should cork this screeners ONLY for stocks in the FNO segment.
Once you get a list of these stocks, create a portfolio of such stocks at Investing.com or on your trading software and start monitoring the stocks.
C. RSI TRENDLINE STRATEGY
To practice this strategy, you should know how to draw trendlines. If you don’t know how to, read this article.
NOW WATCH THE CHART BELOW, IT MAKES FOR A VERY FASCINATING STUDY:
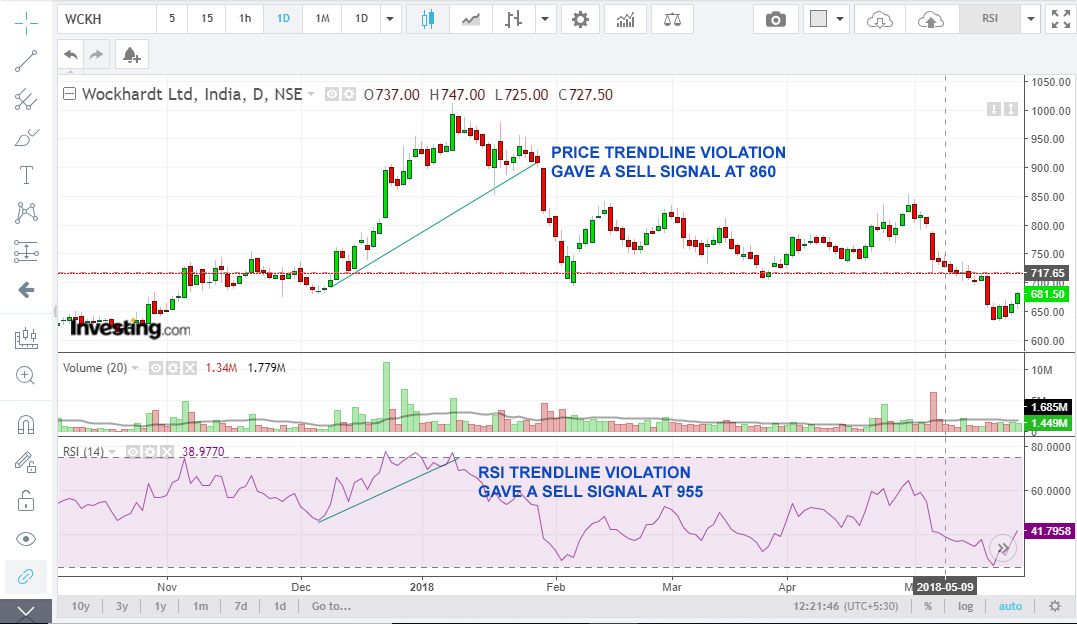
The RSI-Trendline is a deadly strategy and it can give you very effective signals way ahead of time. It is not without reason they call RSI a leading indicator.
In the case above the price started its descent from 900 levels. The fal was very sharp and you would have caught it only at 860 or so.
But look at RSI – the Trendline-RSI strategy gave a sell at 955 – a whopping 100 points before the fall.
Use the trendline on a 1 Day chart for reliable signals.
D. BOLLINGER BAND SQUEEZE- RSI STRATEGY
To apply this strategy you need to learn Bollinger Bands. Here is a post that helps.
Study the following chart:
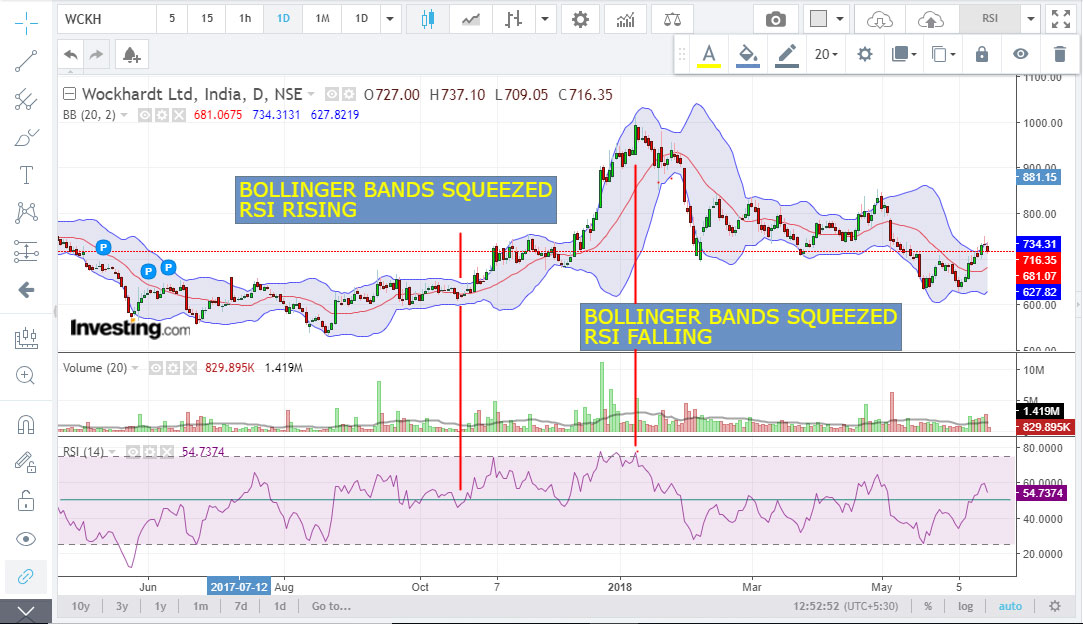
- When the Bollinger Bands were squeezed and the RSI started rising, the stock flew from 630 to 1001.
- The Bollinger Bands got squeezed when the stock was at around 950 levels, and at this point the RSI started falling. The stock crashed from 950 to 710.
Therefore, it also makes good sense to work RSI with Bollinger Bands to increase the chances of making profits.
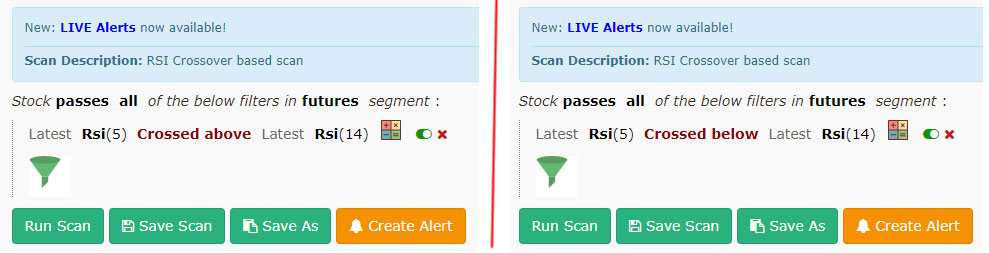
E. RSI CROSSOVER
This is a rather simple but effective intraday/BTST strategy that can hold good for a longer period if charts validate a further move.
Work with the 1 Day charts for getting a reliable signal.
To set it up, you must again use Chartink.com and set up a signal that reports stocks in which the 5-Period RSI has crossed above (bullish) or below (bearish) the 14-Period RSI.
Work only with FNO stocks and Indices.
Once you get the list, apply other technicals such as Bollinger Bands, or our Trade Setup and check if the buy or sell is justified.
F. RSI DIVERGENCE
I’ve come across many false positives while reading the RSI Divergence signals and therefore will tackle these at a later date if necessary.
In my opinion, the signals above are powerful enough to result in profitable trades and therefore I’ll stop for now.
Please perform paper trades and use this article for study and research purposes.
Nice
Thank you so much for your strategies. One of the kind person I came across who teaches fishing rather than giving us fishes. Thanks once again. We look forward to some more.
Good post Sir,very easy to followup
Thank you sir
nice
RSI divergence too is effective. It’s just that it needs to be clubbed with some other pointer like GANN level to catch the change in trend early. You can check it with that.
great sir thank you
Your articles are very crisp, informative and up-to the point. Its reflects your knowledge and expertise.
Thanks Sunil for all your efforts in sharing your knowledge.
Thanks for very detailed and simpler way of explanation. Earlier, It was very difficult to understand these technical charts.
Very detailed. .thanks sir..
Excellent startegies. Noone reveals the secrets you did. Kudos to you.
fantastic work sir,I just joined to this site,it’s very useful & studied
Thans again.
Thank you ji. for these strategies.
Great strategies. Wonderful!
Dear Sir,
Thank you for the fantastic posts, do you have any YouTube channel? If not it would be much useful if you could use video sir,
Kindly consider it
Thank you for your kindness.