Though the Moving Average Convergence Divergence (MACD) indicator follows trends, you can use it to figure out future trends and measure momentum. Here’s how:
COMPONENTS OF MACD
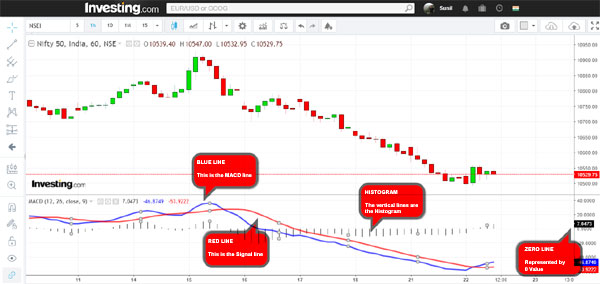
First things first, let’s understand the components:

- The MACD (blue) line is calculated thus: 12 Period EMA (minus) 26 Period EMA
- The Signal (red) line is a 9-Period EMA of the MACD line
- The Histogram calculates the difference between the MACD and Signal lines
- The Zero line (note the “0” value on your right).
HOW TO INTERPRET MACD
A. GENERAL INTERPRETATION
- When the MACD line crosses above the Signal line, the trend is bullish and this is a buy signal
- When the MACD line crosses below the Signal line, the trend is bearish and this is a sell signal
- When the lines are above the Zero Line the trend is bullish and when these are below the Zero line, the trend is bearish
- When the histogram lines lengthen (either way) the momentum (either way) gathers steam
- When histogram lines are above zero, the trend is bullish.
- When histogram lines are below zero, the trend is bearish.
B. FORECASTING SHORT TERM TRENDS (V. V IMPORTANT)
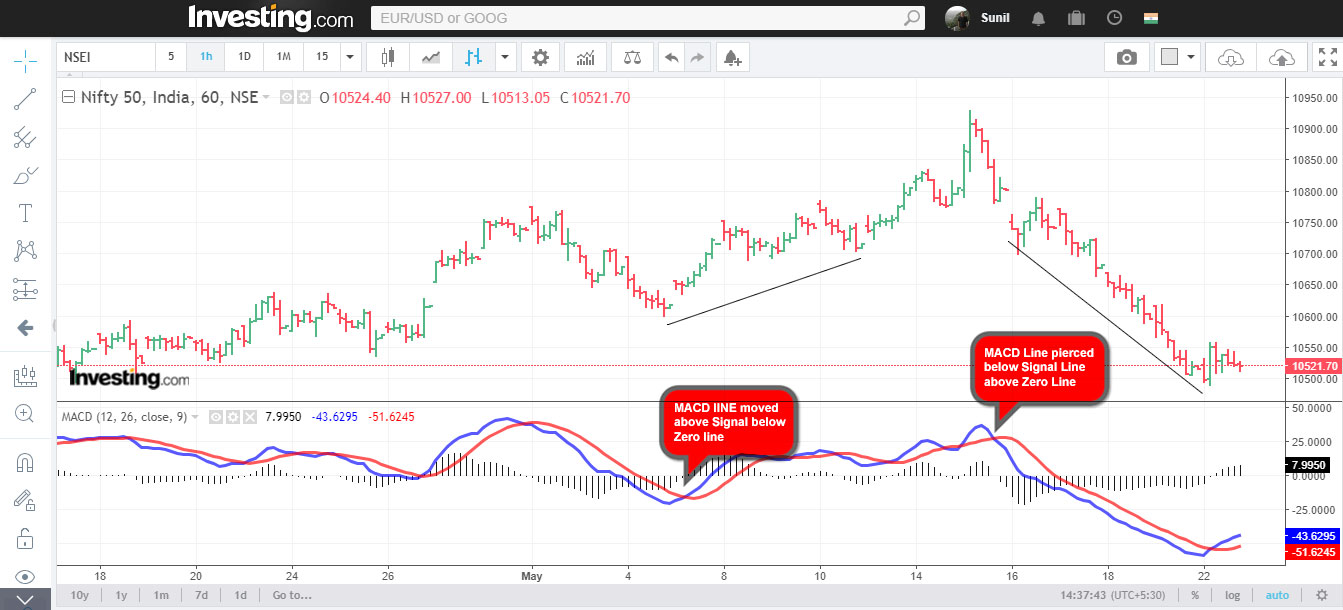
- When the MACD Line crosses above the Signal Line from BELOW the Zero Line, it is a POWERFUL BULLISH signal. USE IT TO TRADE IN ANY TYPE OF MARKET (Choppy, bear, bull).
- When the MACD Line crosses below the Signal Line from ABOVE the Zero Line, it is a POWERFUL BEARISH signal. USE IT TO TRADE IN ANY TYPE OF MARKET (Choppy, bear, bull).
- When the MACD Line crosses above the Signal Line from ABOVE the Zero Line, it is a BULLISH signal. It will give you great results when the trend is bullish.
- When the MACD Line crosses below the Signal Line from BELOW the Zero Line, it is a BEARISH signal. It will give you great results when the trend is bearish.
You can see in the chart how the Nifty spiked and crashed when these lines crossed above and below the Zero lines.
SETTING THE PERIOD
FOR SHORT TERM TRADERS
FOR A RELIABLE MACD SIGNAL, USE THE 1-HOUR CHART. The image above proves that a 1-Hour chart can really leverage the MACD
I recommend that Intraday traders should use the 1-hour period in choppy markets and the 15-minute or 30-minute period when the trend is certain. These periods are more reliable.
CASE STUDY: MACD ON 22-5-18
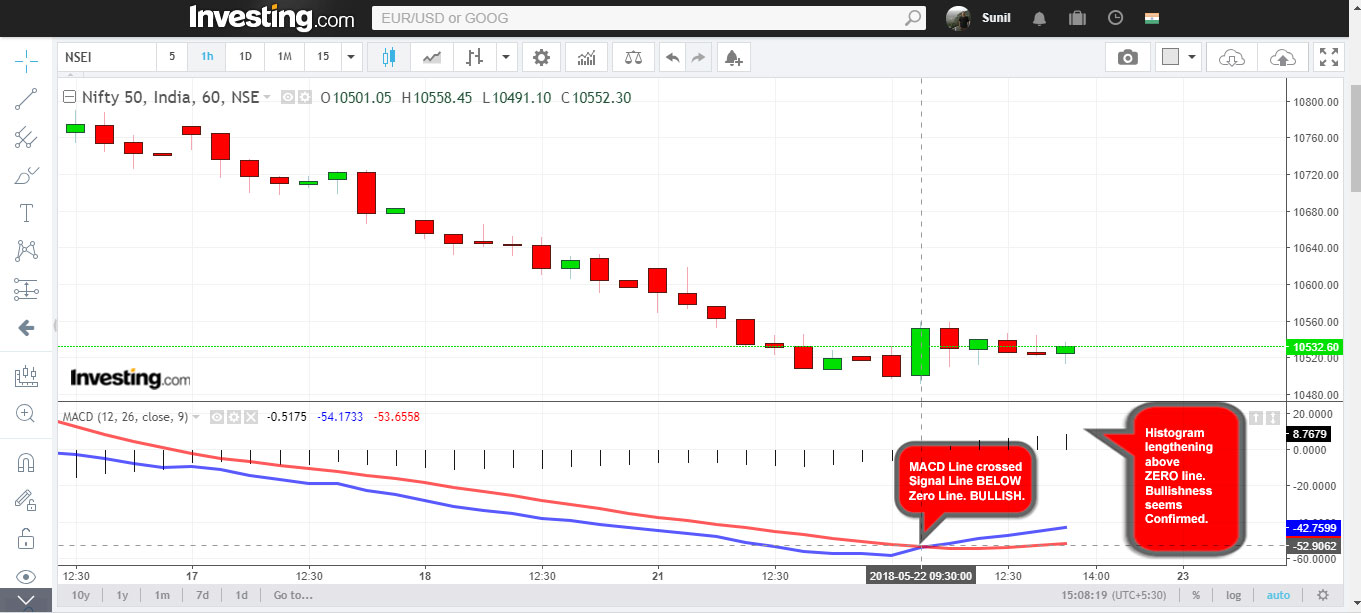
This is how you work the MACD by and large. Many folks jump into a trade at the first opportunity without setting the right period or acting on false cues such as when the Histogram draws a line above the zero line.
Ideally you should use the MACD for trend spotting and then measuring the momentum after the trend proves true.
All the tools that you need to interpret the MACD are right up there. Give it a shot and do some paper trades and see how it goes.
Feel free to ask questions in the comments section.
MACD Line crosses above the Signal Line from BELOW the Zero Line. Is it a better to wait till it comes to zero to get confirmation of the trend. Should should directly get into the trade ?
I’ll add a couple of notes late evening t clarify
Sir,thanks for this article. It is very helpful. Can you please help us with the leading vs lagging indicators? And which ones to be used when.
VERY NICE SIR THANK SO MUCH
Thanks for this article. It really helped.
Nice article!
One question
https://in.investing.com/equities/hindustan-construction-company-chart
If you look out from April 6, MACD crossed the signal line below zero and histogram is above zero line but still price remained constant .
Is it for intra day traders purely ? Any changes that can help a short term trader ?
Dear Sunil ji,
1). Regarding setting the period – What is the right period to be used for Swing trades ?
regs
Sourabh
1 Hour, but confirm the big picture too
Sir you made made my day easy in analysing the trend.Thanks a lot & god bless you greatly for sharing your knowledge.
Hi, MACD looks different on different timeframes i.e hourly, daily, monthly, which one is optimal?
Day-week-month is always safe, but don’t use it in isolation. Subscribe to my YouTube channel for strategies