The Stochastic indicator typically indicates overbought and oversold levels, and most traders buy or sell stocks when these signals are generated, and then find their trades going wrong ans the buying or selling continues after a pause despite the fact the Stochastic is already in an overbought or oversold zone.
Typically, traders use stochastic to buy when it gets into the oversold zone and sell when the stochastic is in the overbought zone. OR, traders look for divergence (rising price-falling stochastic for shorting/ falling price-rising stochastic for buying).
Both techniques are wrong and can result in losses.
Here is how you should use the Stochastic:
What is the Stochastic Indicator?
Stochastic takes the following values:
Close (per Candle)
Highest High (per Candle)
Lowest Low (per Candle)
Then it divides (close – lowest low) by (highest high-lowest low) and then applies a 3-Day Simple Moving Average to the product.
Basically it establishes a relationship between the lowest, highest and close per candle, and by this relationship, it tries to ascertain the momentum of a stock.
By default, Stochastic is set to fourteen periods.
That means, if you work with a 15-minute chart, Stochastic reflects fourteen 15-minute candles; if you use 1-Day chart, then the indicator reflects fourteen 1-Day candles, and so on.
Setting Up Stochastic
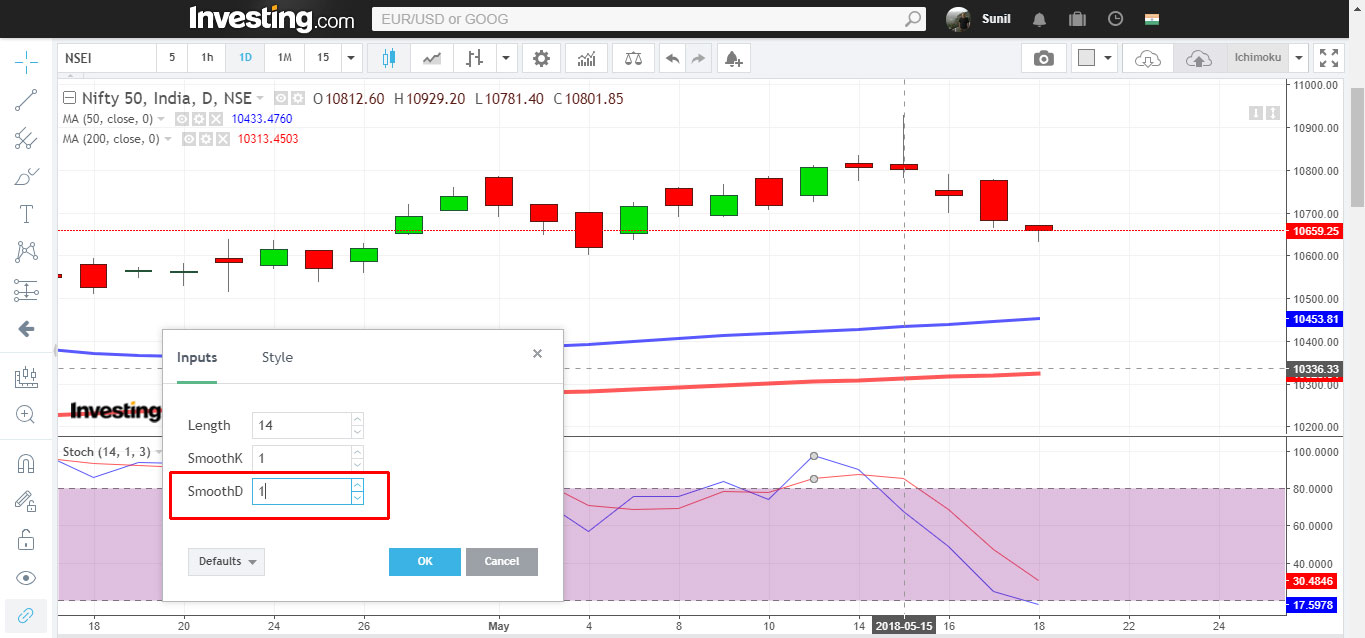
Check the image below. I have removed the SMA (changed it from 3 to 1) as a single Stochastic line will suffice. You can set it up this way or follow the traditional 2-line stochastic, which will increase monitoring activity (you have to check stochastic line crossovers + monitor the price charts and other indicators.
Now, along with the Stochastic, also set up the 50-Day Moving Average and the 200-Day Moving Average, as I have done (check image above).
How To Work The Stochastic Indicator
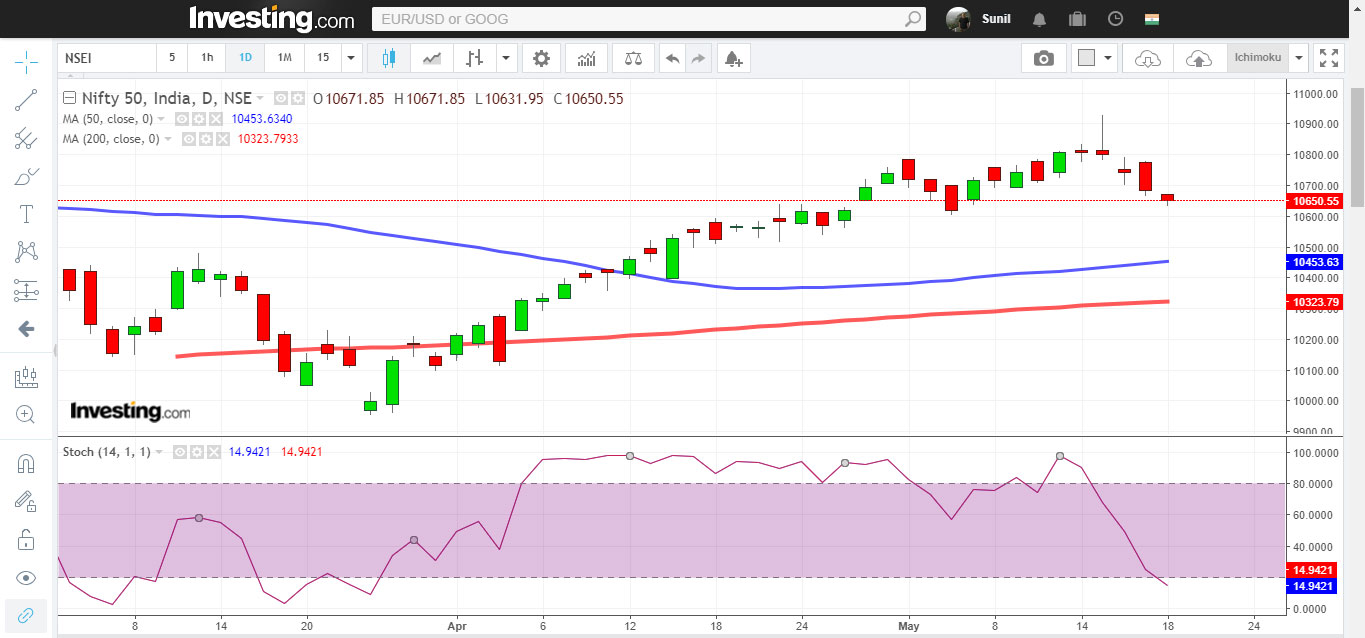
STEP ONE: Set up the 1-Day Chart
Check whether the price is above or below the 50- and 200-Day Moving Averages.
If the price is above these Moving Averages, it implies that the trend is up.
In such cases you should buy the stock or Index when the Stochastic is oversold.
If the price is below the Moving Averages, it implies that the trend is down.
In such cases you should short the stock or Index when the Stochastic is overbought.
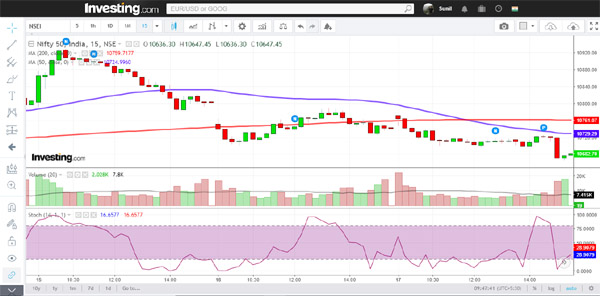
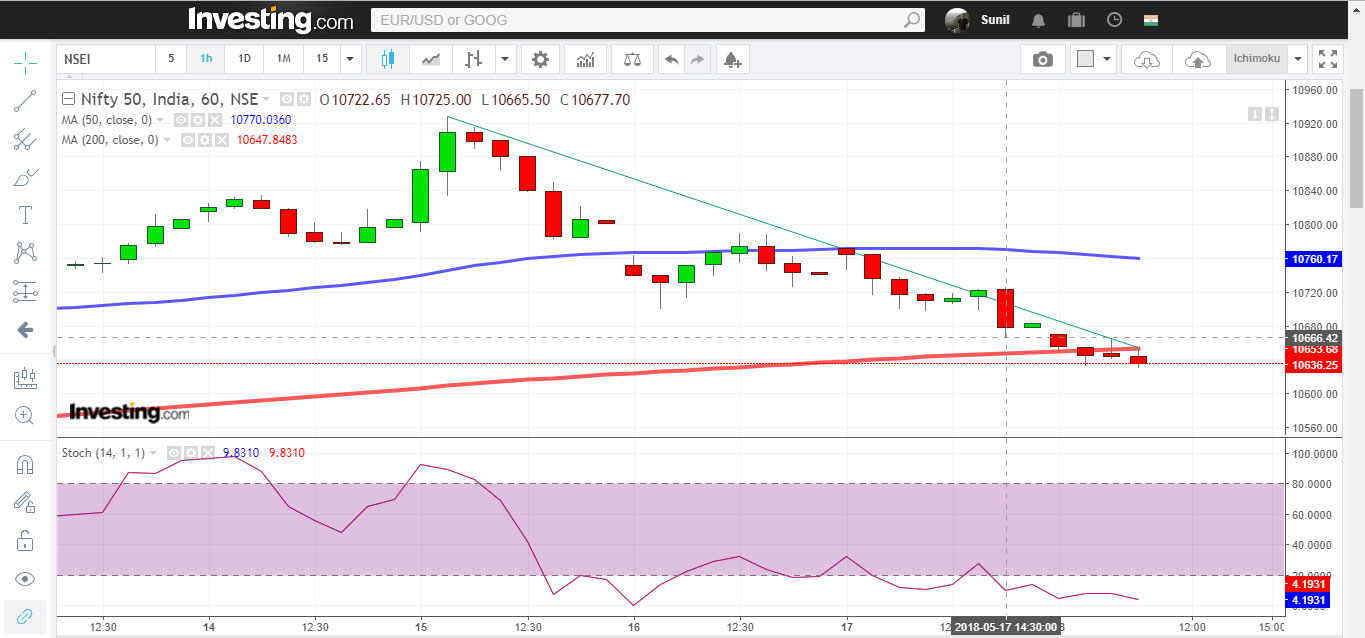
It’s 18-5-18 and the time is 11.35. Let’s check what’s happening to the Nifty at the moment.
Here’s the Reading:
- Nifty is above the 50-Day and 200-Day Moving Averages. This implies Nifty is an uptrend.
- Stochastic is around 15. It is oversold.
Should you buy the Nifty here.
Well, if you are a trader, you should NOT follow the 1-day chart for shorting intra-day.
But the 1-Day chart has given you an overall picture – that the Nifty is in an uptrend and that you must consider that fact before making an intra-day decision (implying that if you short Nifty, you should make quick exits, and that if you are going long, then you can hold positions for some time (maybe a few days)).
Typically, you’d like to use the Stochastic on a 1-hour chart for a reliable trade. So let’s do that now. (Some traders use the 15- and 30-minute candles, and it’s entirely up to you what to use.)
STEP TWO: You know the Big Picture, Now Set up the 1-Hour Chart
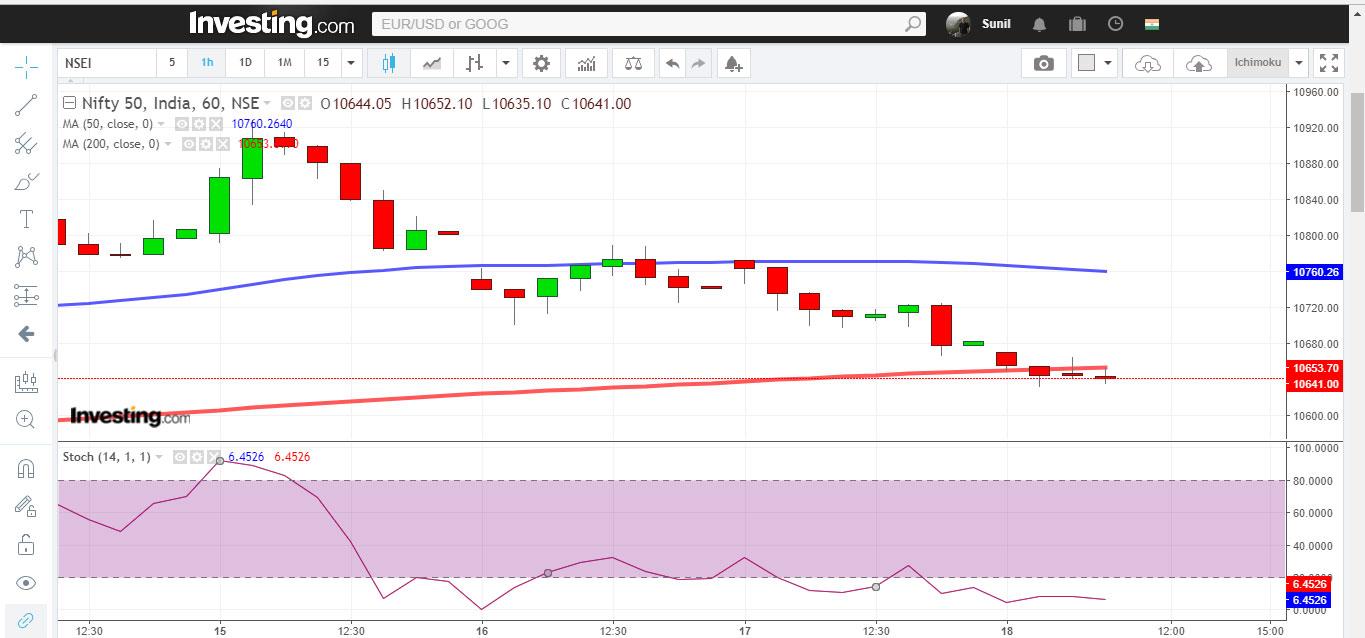
What do we see here:
- Nifty has fallen below its 50-Day MA (Bearish)
- It is just below the 200-Day MA, a bad sign (Bearish)
- Stochastic is 6.5 (hugely oversold)
So, in my opinion, Nifty is not a buy even though it is oversold.
But then what should you do in such cases!!!???!!!
Here’s what.
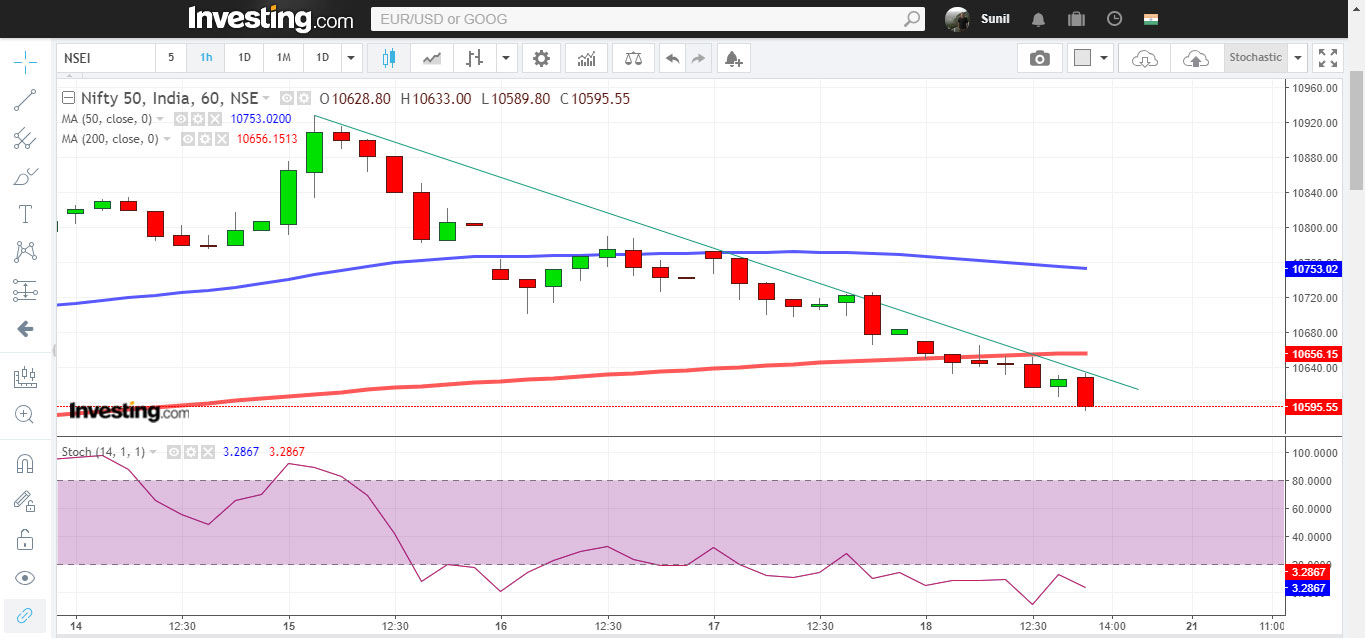
STEP ONE: DRAW A TRENDLINE
If you don’t know how to draw one, read this article.
I’ve drawn a trendline on the Nifty 1-Hour Chart and the reading is:
- The trendline perfectly reconciles (meets) with the 200-Day Moving Average.
- The last candles highest high is 10,655.
- The Nifty is below the 200-day MA and the trendline too, indicating bearishness.
Therefore, I would wait for the Nifty to convincingly cross above 10655 (highest high of last candle), wait Stochastic to turn and wait a whole green candle to cross the 200-Day MA and the trendline before initiating a buy.
Until then I would wait.
This is how you can use the Stochastic. Perform some paper trades on the Index and FNO stocks and see how it works for you before you practice it in real life.
REALITY CHECK AT 3.25 PM
This is the situation as at 3.25 PM
- Though Stochastic was oversold during the day, it did not become a buy.
- Though there was divergence (Stochastic rising, price falling) it still did not become a buy.
This validates our article. Absolute proof of concept.
What would you do if price is in between 50 and 200.. in both cases where longterm(daily) is in uptrend or downtrend?
Which price? If you mean Stochastic value I would use the same criteria and look for divergences.
Hello Sunil,
Thanks for your insights on Stochastic Indicator.
I was doing the same analysis on “Bodal Chemicals” over a 1day chart. And by the chart, the setup was like this:
1. Stochastic was around 75 levels
2. 200 MA was above 50 MA and the candles were above the 50 MA but below 200.
In this Case, What’s your view and also how significant it becomes when a higher MA crosses a lower MA?
I would do technicals only for index and FNO stocks.
Great Post Sir. Thanks for the insights.
When I’ll get trade in macd 50 or 200
I don’t understand your question. Please elaborate.