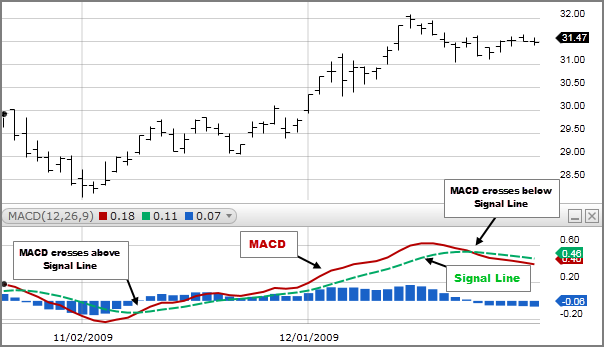
The Moving Average Convergence Divergence (MACD) has many elements attached to it. There’s the signal line (9 Day EMA), the MACD line (26 -(minus) 12 day EMA), the histogram and the zero line.
Without getting into any technical jargon, here’s how you should interpret the MACD:
1. When the MACD line moves above the zero line, it is a bullish signal.
2. When the MACD line moves below the zero line, it is a bearish signal.
3. When the MACD line moves above the Signal Line from below it, and both are below the zero line, it is a super bullish signal.
4. When the MACD line moves above the Signal Line from below it, and both are above the zero line, it is a mildly bullish signal.
5. When the MACD line moves below the Signal Line from above it, and both are above the zero line, it is a super bearish signal.
6. When the MACD line moves below the Signal Line from above it and both are below the zero line, it is a mildly bearish signal.
HOW TO USE THE MACD BULLISH CROSSOVER SIGNAL FOR MAKING PROFITS
Before you use Chartbot’s MACD Bullish Crossover, know that it shows up stocks in which the MACD line has crossed over the Signal line. This signal can be super bullish or mildly bullish (scenarios 3 and 4 above). To confirm the degree of bullishness, you should click on each stock and check the charts and interpret it according to the principles above.
It is also very important to repeat here that MACD is a short term indicator – BUT, it can throw up stocks that can really zoom up in the long run. It does this by clueing you on to stocks that are moving up based on news or events or economic disruptions. Therefore do not consider the Chartbot’s MACD as a short term signal until you have fundamentally analyzed the stocks.
I tried it today and it threw up many stocks, here is what I did:

I picked up Intellect Design Arena and viewed the charts. It said that the MACD line 1t 1.39 had crossed the Signal line at 1.19 on 15-12-17. This was a MILDLY bullish signal BECAUSE the crossover happened about the Zero Line (if it was below, the value of the line would have been in the negative), so I headed over to check what was happening with the stock.
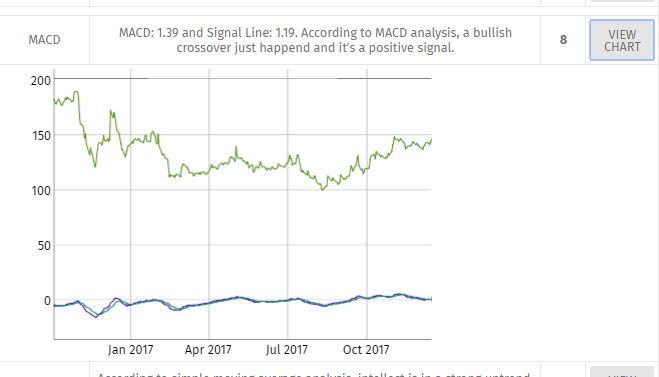
Discovered that:
1. It had reported positive numbers for the September quarter.
2. It had developed a new secure technology for banking transactions, which was winning awards and gaining recognition.
3. That the promoter had hiked stake from 29% to 31% during the quarter ended 30 September.
These are all bullish signals and if markets remain steady, an investment in Intellect Design Arena can be considered for the short term with a stricg stop loss of 5-7%.
Well, this is how the MACD indicator works and how you should use the Chartbot’s MACD Bullish Crossover tool to figure out how to identify stocks with potential.
Happy stock picking!
Sir, MACD value = 1.39 (Intellect Design Arena) comes when EMAs are calculated over last 6 months chart.
If we look on 5 day basis charts then MACD -Ve and divergences are micro spreaded.
PLease suggest users how many days charts should be look into to take decision on the basis of MACD bullish/bearish signal.
Thanks
This is an API I am using. Why not do some mock trades and check it out if it works? I have and it did work out for me.
Sir, Can you please provide the link to Chartbot?
It’s discontinued because the vendor closed down
Chartbot’s MACD Bullish Crossover,
The above hyperlink is wrongly linked to one of your other post.
Thanks for pointing it out, I’ll rectify it. Charbot vendor stopped data sales