To understand what price action is and how it should be analyzed, you got to first understand candlesticks.
Here are a couple of helpful articles. Read these before getting started here:
Understanding and Interpreting Candlesticks
Powerful Candlestick Formations
What is Price Action?
Price Action involves analyzing candlesticks and predicting future movements. It does not involve using indicators such as MACD, Bollinger, RSI, etc.
However, it does involve using:
a. Exponential Moving Averages (20, 50 and 100 [some folks use 200])
b. VWAP
c. Trendlines
d. Support and Resistance levels
As VWAP is included, I’m not including volumes.
Price Action + Technical Indicators = Lethal Combination
If you rely on charts AND on price action, your successful trade percentage will increase.
For example, assume that the indicators on Daily charts are bullish. But when you check the 15-, 30- and 1-hour charts, you find that price action suggests that there has been selling in the last hour, and yet the indicators are in a bullish zone because there was buying during the earlier part of the day.
What will you conclude?
If you are an experienced chartist, you will wait to see how the action pans out the next day morning before making a decision, and without relying blindly on the indicator signals thrown up by the daily charts the previous day.
Therefore, you always must analyze charts based on indicators and price action.
How To Read The Candles
Every candle can reveal a lot of information.
Whatever period you are using, ask the following questions per candle:
How has the candle closed – up, down or static? (up = bullish; down = bearish; static = range)
Did it completely cover (engulf) the previous candle? (for bullish and bearish engulfing signals)
Did it engulf a few previous candles? (for extremely bullish and bearish engulfing signals)
Is the current candle much larger or smaller than the previous candles (indicates breaking out or a range, or starting a trend – bullish or bearish)
What is the relationship of the current candle with the trendline? (Has it violated the trendline?)
What is the relationship of the current candle with the EMAs? (Has it violated the EMAs?)
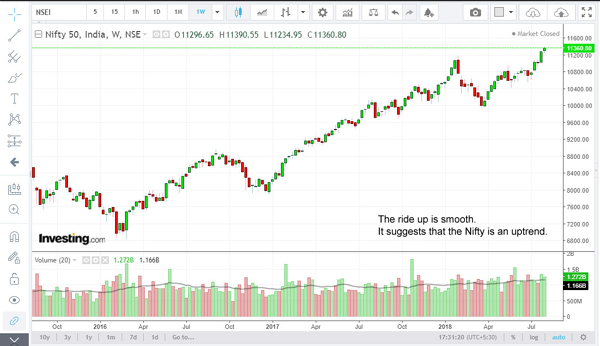
Is the chart smooth or choppy? To understand this you have to view at least 200 candles. Let’s take two examples:

Check the Nifty Weekly chart above. It suggests a nice smooth upward movement. When you come across such charts, it can be safely assumed that the stock is an uptrend (or an downtrend in case the movement is smooth on the downward side), and therefore can be considered for a swing-to-short term position.

This is the weekly Coal India chart. As you would have observed, there is a lot of choppiness. When you come across candles that seem all helter skelter and with long wicks, you should work intra day and not take any overnight positions. Else, you should avoid such stocks unless a trend sets in.
This concludes the basics.
Practice this theory on charts and see where it leads you.
This article will take 5-6 posts. In the next post, I’ll write how to discover support and resistance levels, trendlines, candle reading and price action trading strategies.
When all articles are done, an index will be created.
Excellent sir though I am trading since an year. Started learning patterns from Ur posts. Thanks for knowledge sharing.
Very useful im waiting for next part
Very interesting read. Waiting for the next updates on this topic.
Simple yet powerful information. Please keep them coming.
Dear Sunil ji,
I admire your posts. They are easy to understand for a beginner like me. I wanted to understand if there is a way to easily get info. on some chart patterns every day. For example, if I am interested in stocks that have witnessed huge volumes on a day, is there a way to get such a list ?
Secondly, I came across a chart of Suven around end-Jan. There was a huge surge in volume and price jumped. But the next day it started falling and fell to its 52 week low. Why did buyers not emerge to halt the fall even at lower prices if there was huge buying interest just a few days ago ?
Thank you for your help.
1. Use chartink screener. Or use bse/nse volume spikes data.
2. I don’t recommend solely relying on technicals for cash stocks