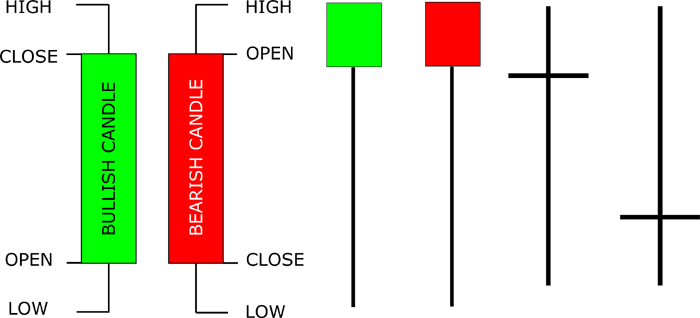
Candlesticks are the Japanese way of representing price movements on a chart. Candlesticks are pretty comprehensive, and these cover the opening, closing, high and low prices.
The opening and closing is represented by a body that looks like a candle (hence the name) and the wicks (if any) on the candle represent the high and the low of the day.
The table below explains the concept of candlestick formation in detail.
After understanding candlesticks, you may want to check them out on charts.
If you are a day trader, set the candlesticks period to 10, 15 or 30 minutes. If you are a BTST kind of guy, set it to 1 or 4 hours. If you are an investor set it to weekly-monthly.
This is the first article in the series. The next set of articles will explain chart patterns (one article per chart pattern) and in those, you will be able to figure out how these formations play out. Stay tuned for those articles.
| CANDLESTICK FORMATION | INTERPRETATION |
|---|---|
 | Bullish candlesticks are coloured green, blue or white. A bullish candlestick implies that the closing price was higher than the opening price. The candlewicks that you see at the top or bottom are also referred to as shadows. Both the body (or the lack of it) and the shadows are extremely important to understand. |
 | Bearish candlesticks are coloured red or black. A bearish candlestick implies that the closing price was lower than the opening price. Same comment (above) on candlewicks/shadows holds good here. |
 | UNDERSTANDING BULLISH CANDLES - EXAMPLE 1 In this example, the stock opened at 95, hit a high of 105. Sellers emerged at this rate and the stock closed at 100. Such candles can be interpreted as moderately bullish esp if they form after a spate of red candlesticks. |
 | UNDERSTANDING BULLISH CANDLES - EXAMPLE 2 In this example, the stock opened at 100 and bears hammered it down to 95. From there on, the bulls took charge and bought the stock, which closed at 105. This signifies bullish. |
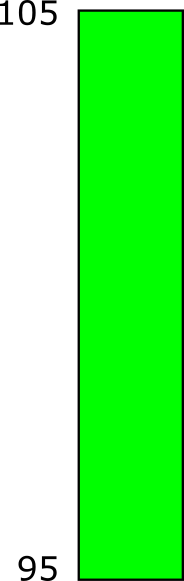 | UNDERSTANDING BULLISH CANDLES - EXAMPLE 3 A GREEN full bodied candlestick without any wicks is referred to as a Marubozu. In this example, the stock opened at 95 and closed at 105. The chargeup was relentless signifying huge buying interest. This candle signifies solid bullishness. |
 | UNDERSTANDING BEARISH CANDLES - EXAMPLE 1 In this example, the stock opened at 100, zoomed to 105 and then the hammering started dragging it all the way to 95. This is a bearish candle that suggests sellers are waiting to hammer down the stock or investors want to get rid of it for whatever reason. |
 | UNDERSTANDING BEARISH CANDLES - EXAMPLE 2 In this candle the stock opened at 105, fell to 95 and recovered to 100. THough this is a negative, it is not a majorly negative candle. |
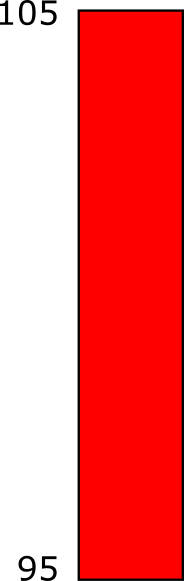 | UNDERSTANDING BEARISH CANDLES - EXAMPLE 3 This is a full bodied bearish candle, also a Marubozu. The stock opened at 105 and witnessed a feww fall to 95. It is a very bearish candle. |
| (DOJI) | A Doji is a candlestick that is formed when the closing price is almost the same as or equal to the opening price. Here are the different types of Dojis: |
| HORIZONTAL DOJI This could mean that the stock closed at UC or LC OR if this is happening in the middle of a trend (bullish or bearish), it could signify a reversal |
|
 | DRAGONFLY DOJI The stock opened at 105, hit a low of 95 and then recovered to close at 105. This could be anything - short covering, reversal of trend (if it occurs when the share is continuously falling) or indecision. |
 | GRAVESTONE DOJI The stock opened at 95, saw a good amount of buying and touched 105. Then the sellers started dumping and it crashed back to 95. This can be a bearish signal in a bull market, or maybe even a sign of reversal in a full blown bear market, or a sign of indecision in choppy markets. |
 | DOJI STAR In this example, the stock opened at 100 hit a high of 105, a low of 95 and closed at 100. It reflects indecision. |
 | LONG LEGGED DOJI Reflects indecision |
 | GREEN CANDLE WITH LONG WICK AT TOP Long candle wicks or shadows are extremely important to understand. In this example, the stock opened at 95, hit 105 and closed at 98. This candlewick can be interpreted as a sign of indecision. |
 | GREEN CANDLE WITH LONG WICK AT BOTTOM The stock opened at 102, hit an intraday low of 95 and closed at 105. This candle indicates bullishness. |
 | HANGING MAN (GREEN) The stock opened at 103 was bashed all the way down to 95 and it closed a little above the opening. It can be interpreted as a sign of bull exhaustion in a bull trend and as a sign of indecisiveness (or even trend reversal) in a bear trend. |
 | RED CANDLE WITH LONG WICK AT TOP Stock opened at 98, hit 105 and closed at 95. This indicates there is supply at the higher level. |
 | RED CANDLE WITH LONG WICK AT BOTTOM Stock opened at 105, crashed to 95 and later recovered to 102 indicating that there is buying at lower levels. |
 | HANGING MAN (RED) Stock opened at 105 and was hammered down to 95. But it recovered well to close just below its opening price at 103. This can be a sign of selling exhaustion in a bear trend or a sign of minor profit taking in a bull trend. |
VERY INFORMATIVE ……. WELL DESCRIBE
Very Accurately Explain, WOW.
Bullish candle pattern formed by JM financial ,it is locked in upper circuit.
Sir,
Want to know that will JM financial will cross 120 ?
I have just started learning .
1)As per weekly chart showing bullish.
2) Touched BB upper.
3) MACD
4) RSI
Above indicator showing bullish.
1 more reason is Hotelleela selling stake in which JM financial had Invested.