Strategy # 1: Price Action, EMA and Trendline
Use
(a) 1 Hour Candles
(b) 20 Period EMA
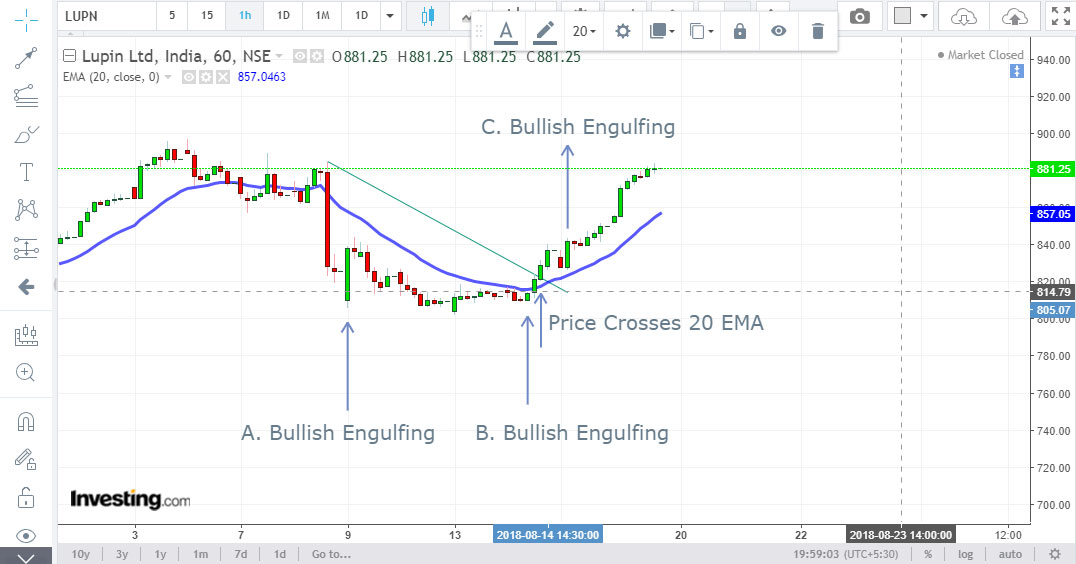
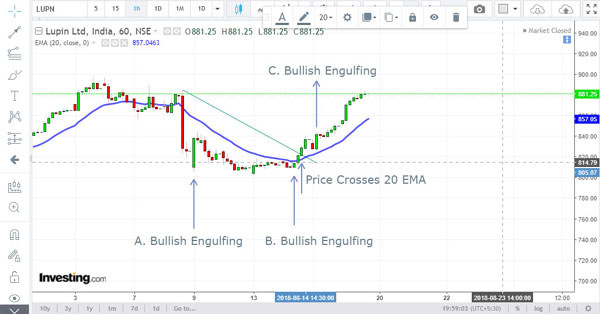
Example used: Lupin 1 Hour Charts
Step 1: Draw a trendline if feasible. You now know the breakout or break down ranges.
Step 2: Plot the 20 EMA.
Step 3: Look for bullish and bearish engulfing candles.
INTERPRETATION
If price is below the 20 EMA and the trendline, then a bullish engulfing candle may not mean much (See point A marked in the chart above). But it can also signal a reversal, as you can see in point B. So you must watch out for such candles when the price is below the trendline and 20 EMA.
If price is below the 20 EMA and the trendline, then a bearish engulfing candle can signify a deeper correction. Though I have not marked it on the chart, you can view a bearish engulfing candle (3rd candle from Point A) and see that the price corrected after it formed, and that the price fell after this candle was formed.
If price is above the 20 EMA and also above the trendline, then bullish engulfing candle can be sign of a massive rise (See point C marked in the chart above).
A medium-long candle crossing above the 20 EMA is a bullish signal irrespective of the fact the price crosses above the trendline or not. Such candles need not be engulfing.
A medium-long candle crossing below the 20 EMA is a bearish signal irrespective of the fact the price crosses below the trendline or not. Such candles need not be engulfing.
Setting Up Screeners for this Strategy
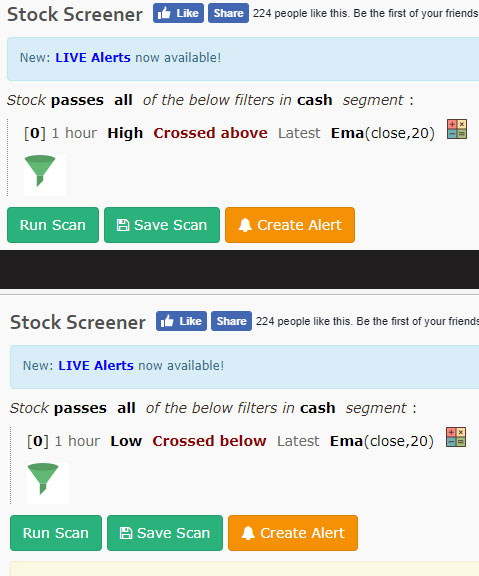
Use Chartink.com to set up the following screeners:
1 Hour Candle crossed above 20 EMA
and
1 Hour Candle crossed below 20 EMA
Use it for FNO stocks and indices, not for cash stocks.
Once you get a list of stocks open their charts and start analyzing and trading. Do paper trades or in 50-100 stocks per trade until you are comfortable.
This was the first strategy in the price action strategy. There will be 3-4 more. Stay tuned.
Hi Sunil,
What is the criteria for Step 1 ?
Hi Sir,
As you have mentioned in bold, Use it for FNO stocks and indices, not for cash stocks.
and the chartlink screenshots posted where in Cash is being filtered instead of ‘Futures’ option.
Pls correct me if am wrong?
Please follow the article. Te screenshot is for the formula. Stick to FNO stocks.
Change to Futures
Someone suggested 21days DMA, 21 being a Fib number.
sir cash stock ke liye bhi bataye please
Sir, Thanks for this post… May I know technical Stop Loss for this type of entry?? is it below 20EMA??
The screeners above when clicked upon do not work
Can someone guide /help for the same
Good strategy. Very well written and easy to understand. looking forward to support and resistance it confuses sometimes.