This is a contrarian strategy that makes you go against the trend, by combining price action with EMAs (Exponential Moving Averages).
Like all contrarian strategies, this too is risky and therefore must be played with strict stop losses.
However, if you play it right, it can generate very profitable swing trades.
Ad remember that by playing contrarian, you are going against the herd and that’s a good thing. Let’s start:
1. CONTRARIAN STRATEGY: INDICATORS/CHART PERIODS
50 EMA
5 EMA
Daily Charts
2. FACTS & ASSUMPTIONS
1. The EMA is closely aligned with the current price.
2. If the price is at an extreme divergence to the EMA, then wither the price will catch up with the EMA or the EMA will course correct itself and align closer to the price.
3. A candle with a long body implies solid buying (when green) or solid selling (when red).
3. WHAT TO WATCH OUT FOR
When price is at extreme divergence to 50 EMA on the Daily Charts.
4. SCREENER
Set up 2 screeners for your contrarian bets:
FOR GOING SHORT
Latest Daily Price Greater Than EMA 50
FOR GOING LONG
Latest Daily Price Lesser Than EMA 50
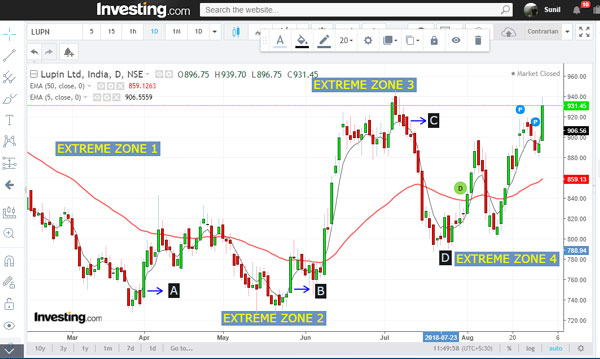
5. TRADING STRATEGY WITH EXAMPLE
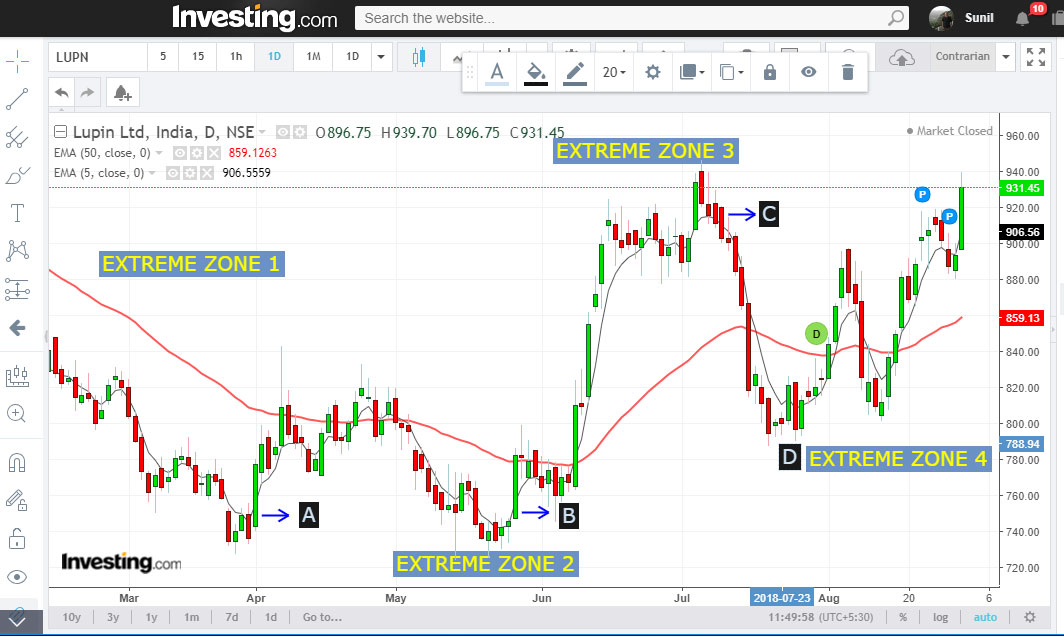
I have marked areas where there is an extreme difference between the price and the 50 EMA as extreme zones.
There are 4 such Extreme Zones marked.
The thin black line is the 5 EMA.
Here’s what you should do:
(a) Watch the candles in the Extreme Zone
(b) Look for long bodied candles that cross the 5 EMA either on the way up or way down in such zones.
(c) Trade Contra to the trend established by the 50 EMA.
EXAMPLES OF CONTRARIAN TRADES
Extreme Zone 1
Price had fallen way below the 50 EMA, which was trending down, when at point A, a large bodied green candle crossed above the 5 EMA.
That was an indication to contra traders.
Lupin climbed up from 771 to 842 from this point in just 5 days.
Later it fell below the 5 EMA and retested its recent lows.
Extreme Zone 2
Price had fallen way below the 50 EMA, which was trending down, when at point B, a large bodied green candle crossed above the 5 EMA.
That was another indication to contra traders.
Lupin climbed up from 781 to 927 in 27 days.
Though there were red candles after this contra signal was generated, none of the red candles broke down below the 5 EMA convincingly. This was an indication that one could hold on to positions, which were anyway in profits.
Extreme Zone 3
Price had risen way above the 50 EMA, which was trending up, when at point C, couple of large bodied red candles crossed below the 5 EMA.
That was a sell indication to contra traders.
Lupin fell from 901 to 790 in 9 days. The reversal (or short covering signal) was at point D.
Extreme Zone 4
As for now, Lupin is in Extreme Zone 4 and shorters should watch price action and 5 EMA from now on – with a strict SL.
Simple but great lesson Sir! Kudo’s
Excellent post sir . We will try as directed
But I have a doubt.
1.What if the 50 DMA is always rising? The 5 DMA anyhow will be close to the Price.
But price can break 5 EMA either side.
Also, the gap between the price and the 50 EMA must be significant.
Please post such type of strategy for intraday, on the basis of price action.
Beautiful strategy
Excellent article,keep up the good work..
What are the chances that it will reach or cross 50ema before resuming its original trend—-meaning to ask what should be the exit point?
Can this be used for intraday..
Wht if I choose red candel instead of green candel
Thanks a lot sir !!! very nicely explained ..
can 20 EMA be used for this strategy isntead of 50 EMA?