NR7 refers to Narrow Range 7 (in this case, 7 Day Period on the charts).
What is Range?
Range is the High (minus) Low of a candle.
The 7 Period refers to 7 candles on the Daily (One-Day period) Charts.
Narrow refers to a candle that has the narrowest range (High (minus) low is the lowest out of seven days).
The NR7 concept starts from the day on which the narrowest (out of 7 candles) occur.
In other words, the NR7 strategy starts from the day on which the shortest candle (including wicks) out of 7 is formed. That implies that the 6 candles prior to it must be taller than it.
THEREFORE…
Step 1 is to identify the NR7 Day and this screener will help you do that.
You also can set up your own screener based on the formula on the page above.
Using the screener at EOD you will get a list of stocks that have formed the NR7 candle for that day.
What is the Concept behind NR7?
According to the NR7 concept, when the narrowest range (shortest candle) occurs, it is a sign that volatility has contracted and the stock is now ripe for a break out on either side (up or down).
Therefore, you need to mark the support and resistance of the NR7 Day and use it as a reference to engage in a trade.
Remember that the NR7 signal is valid for a short term. You can assume that the signal will last between 1 and 6 days. Higher, if you are lucky.
How To Trade the NR7 Signal
You will need:
1. Daily Charts in Stage 1 (to create support and resistance levels)
2. 15 Minute Charts subsequently.
3. A switch over to Daily Charts at EOD and then again a switch over to 15 Minute Charts during trading.
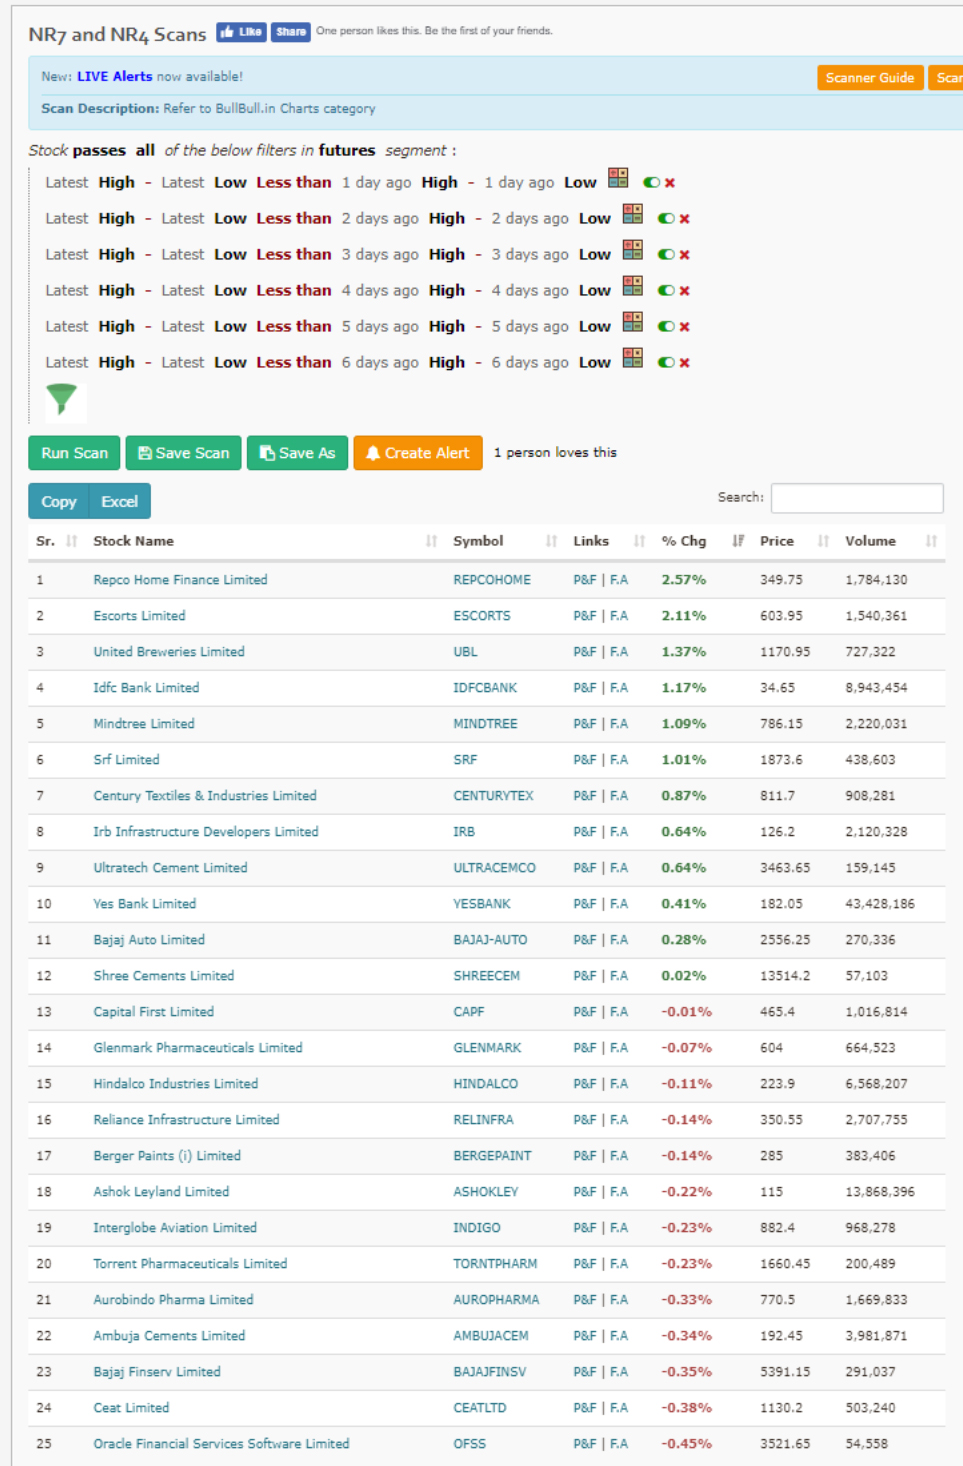
It’s 6.15 PM now on 30-10-18. Let’s check out what the NR7 screener has thrown at us EOD:
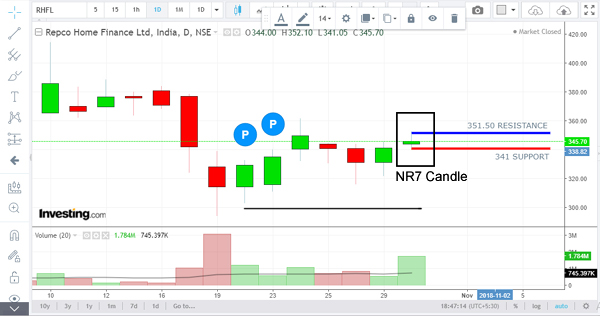
Let’s go with the first stock – Repco Home Finance.
As you can see, today’s candle has the narrowest range as compared to the the 6 before it.
Today was the NR7 day for Repco Home Finance.
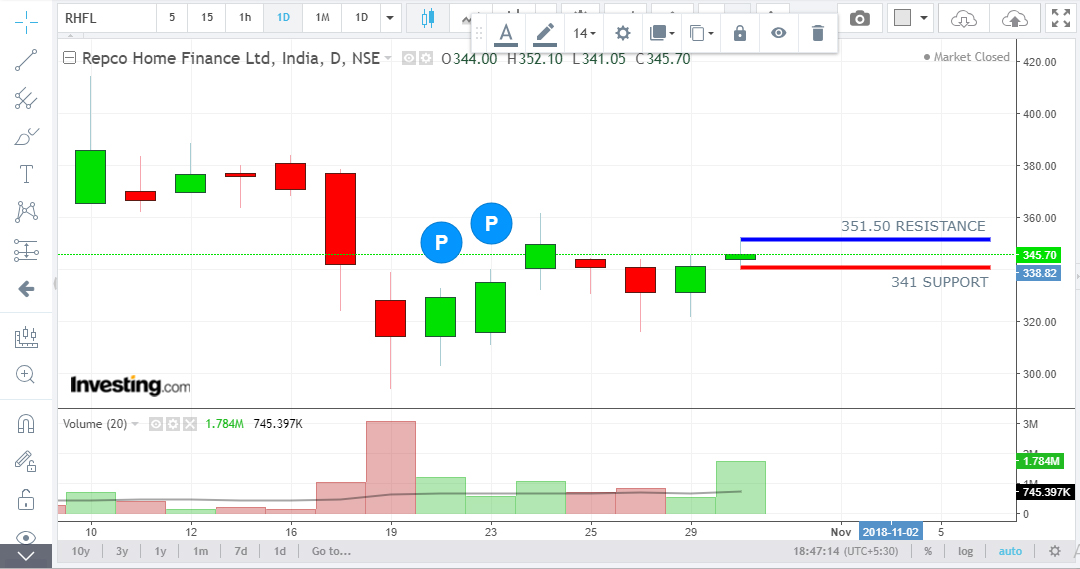
So, here’s what you need to do next: Mark the high and the low of the day.
The high is the resistance – around 352 and the low is the support, about 341.
Right, the next step is to switch to 15 Minute candles:
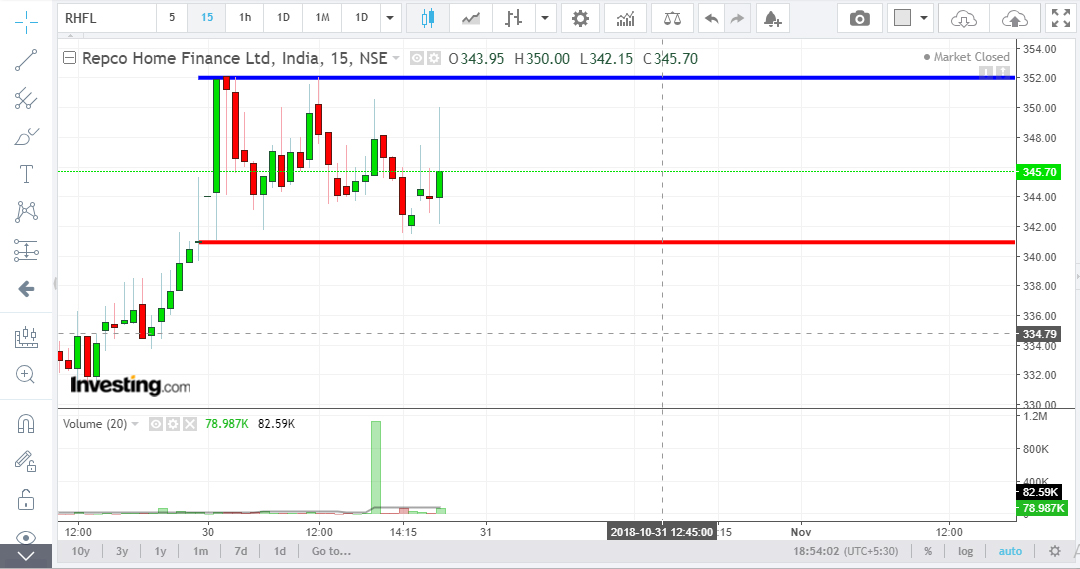
Right, now you have the range for tomorrow (31-10-18).
Your job is now made easy – BUY if 15 minute candle decisively breaks 352 or SHORT if it convincingly pierces below 341.
Your stop losses are the Support & Resistance lines. If the trade works in your favor, trail the stop loss.
This way you can discover stocks every EOD, set up your trade every night, set alerts per stock and be ready for intra day trade in the morning.
The beauty of the NR7 trading strategy is that it is extremely easy and 70%-80% effective. Try it tomorrow – you have the screener and you know the method now.
What is the NR4 Trading Strategy?
It is similar to NR7 strategy except that you have to choose the NR4 Day instead of the NR7 Day and apply the same logic you read upstairs.
You can try it using the screener above. Instead of comparing the latest candle with the previous 6 candles, compare it with the previous 3. That’s it.
Go ahead and paper trade this tomorrow and tweet if it worked on any stock.
Good Morning sir,
A very informative article. but here just to know, trade to execute next day only after watching price action in first 15 minutes candle ? have i understood correct ?
regards,
Not the first. If any 15M candle during the day decisively breaks through either the resistance or support, then it is a signal
Sir big sharks are more clever. in your above example if we track “Repco” only. it crossed 341 lower during 10.15 candle and even went up to 336 in the next candle….but…but…..see thereafter. same day it closed at 369 and today 381 :))
what more precautions should we have? in my opinion we should have positions in 2-3 stocks based on study so that if one stock is not going in our favor, at least another may go.
e.g in the same example if we track “Escorts”too, its made high of 609 and low at 589 on 30.10.18
next day(31.10.18) during 13.15pm candle it crossed 609 level and went up to 629 during 2.30 candle. if one would have taken position at 610, then he would have secured 18-19 points on 31.10.18 itself
what do you suggest ?
regards
I suggest you read through my blog. I have written many strategies that you can combine with Nr4/NR7 to sense the signals at a very early stage. 🙂
Amazing data provided by you. Thanks for sharing with us. Keep up the good job!
Very good statargy sir.. but RR is very high.. SL is resistant or support is very long sl..
Use 20 EMA for SL
i like the way u try to impower general person. however i have some query in this topic, where we should make our position
1) as soon as a stock crosses up or down in 15 min. or wait for another 15 mins. chart after sustaining above or below the support or ressistence point ? thanks in advance.
Wait for the candle to be formed below or above the lines
thanks i got my answer in 1st question.
another question in continuation to one question put in comment. if we buy sl will be 352 here (resistance) if we sell sl will be 341 (support) have i understood correct. than how sl will be very long (as asked in earlier comment where u replied 20EMA for SL
Yes, your understanding is correct. Re SL range, it depends on person to person, so I suggested 20 EMA
Sir, thx a lot for explaining the NR7 strategy, my doubt is will it work very next day or has to wait for few days ? thx in advance
Bharath ji, read the comments in question raised by me and Piyush ji and replied by Sunil sir above. in my opinion wait for signals, it may come very next day and if not come in next day you may check every day for new stocks and if same stock is appearing again and again repeat the action.
e.g check the NR7 list given above. there is another stock “YES BANK”. if you track it, you will find that its high level on 30.10 was 190 and lower level at 181 but on 31.10 it did not break any level lower or upper. but it broke 190 level today 01.11.18 during first candle itself and closed at 204/-
regards
Is is compulsory that first 15 minutes candle break high or low of marked line or any candle.
Please let me clarify it.
thank you sir
Sir please share scanner link with filter
Hello Sir. Can we apply this strategy to a stock and use the outcome to trade in their futures?
Yes, it will work. However, add the 15minute strategy to NR7 to sharpen entries and exits
Thank you very much sir.