Moving Averages are used to enter and exit trades and also used to determine short-long term trends.
Here are some their ‘ secrets:
1. Simple v/s Exponential Moving Average (SMA v/s EMA)
The simple moving average divides the prices by the period specified. It is a simple division. The EMA gives more weight to the current price.
Therefore, the EMA is much faster than the SMA that is a pro for the EMA.
But that also makes it prone to whipsaws. So that is something you need to watch out for.
However, if you set a long SMA, then you may miss out on entry and exit chances.
Animesh Chanchani, an accomplished TA uses shorter EMAs and longer SMAs.
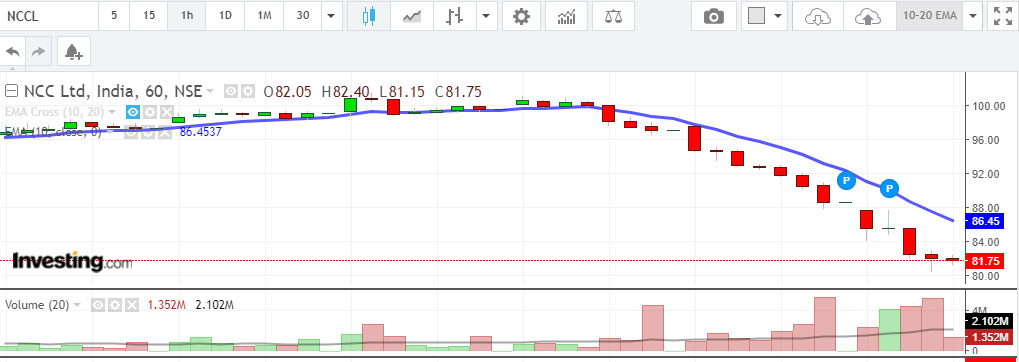
2. The 10 Period EMA Signal
Many professional day traders watch the 10 period EMA like a hawk. 10 days represents 2 business weeks, and they feel that this is sufficient given the volatile nature of the market.
If price remains above the 10 EMA, the trend is bullish and vice versa.
You can use this strategy for any period, but most traders use it on 5M, 15M, 30M and 1H charts.
Here’s an example of a 1 Hour Chart of NCC Ltd. Check and see how the price behaves when it violates the 10 EMA (the blue line):
3. Price Direction Forecast
Many traders use the 20 EMA on 1D and 1W charts to determine the overall direction of the stock.
If the 20 EMA is flat, the stock is in a range.
If the 20 EMA is heading upwards, it implies a bullish trend.
If the 20 EMA is heading downwards, it implies a bearish trend.
Here is the 1D Chart of NCC. Check how the 20 DMA indicates the movement.
The lesson is watch the 1D chart first, wait for the price t crossover the 20 DMA (either side) and then switch to a lower period 30M or 1 Hour to check if the trend indicated by the crossover continues. If it does, then the stock can be considered for buying or selling.
You also must watch for MA flatness. A flat range translates into low volatility, and when a stocks start moving out of the flat period, it can explode on either side, as you can see from the chart below.
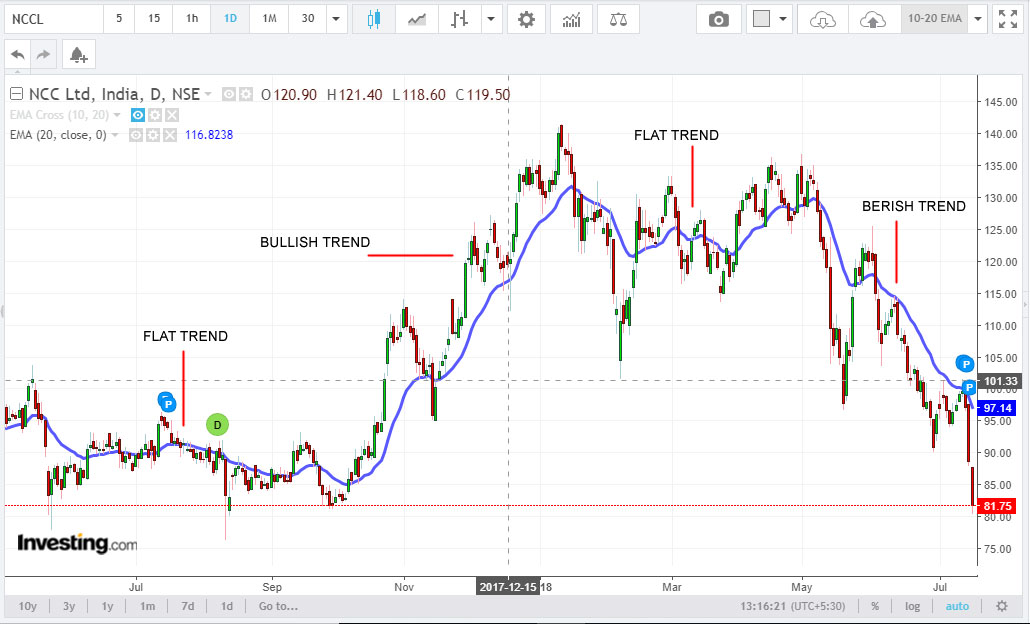
4. The Angle
When the MA starts moving at a steep angle, it indicates buying frenzy (when it starts moving up steeply) or selling pressure (when it starts moving down steeply). You can check this on the NCC chart above.
The lesson here is the same as above – wait for the price t crossover the 20 DMA (either side) and then switch to a lower period 30M or 1 Hour to check if the trend indicated by the crossover continues (by watching the candles).
5. Distance between Price and MA
In a choppy market, the price will stay close to the MA.
When the market is bullish, the price will be much higher than the MA, and when the market is bearish, the price will be much lower than the MA.
Here’s an example – The 1 Week charts of Lupin (Typically used by Medium Term Investors):
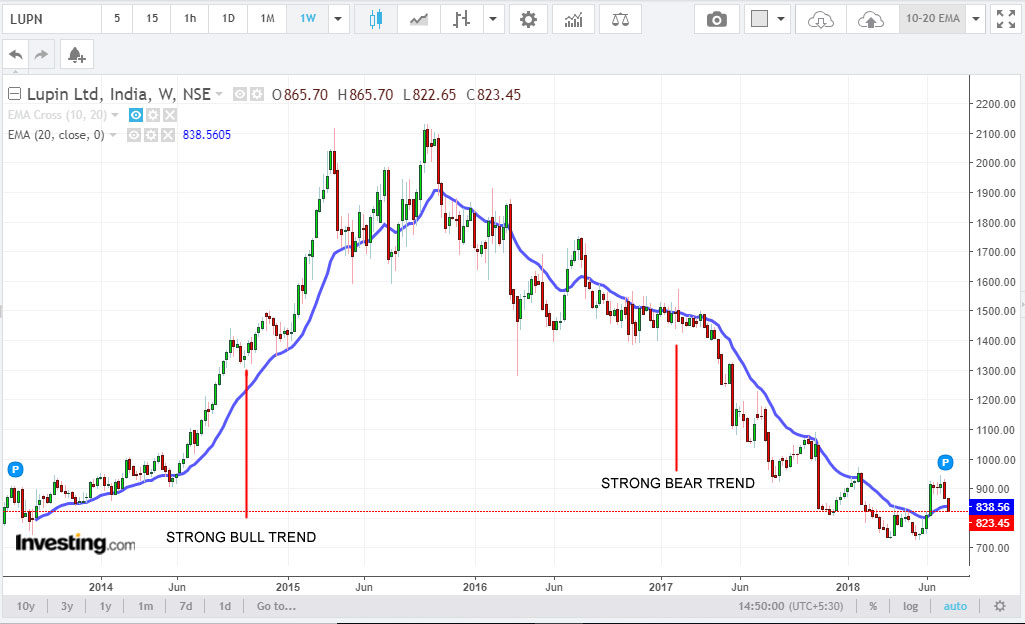
Always remember that if you must keep checking lower and higher timeframes to ascertain the short and medium term movements of your stock
6. Using MAs as Support and Resistance
You can use various EMA periods to determine support and resistance – 10, 20, 30, 40, 50 are often used.
Let’s take two examples:
7. Trend Strength Confirmation
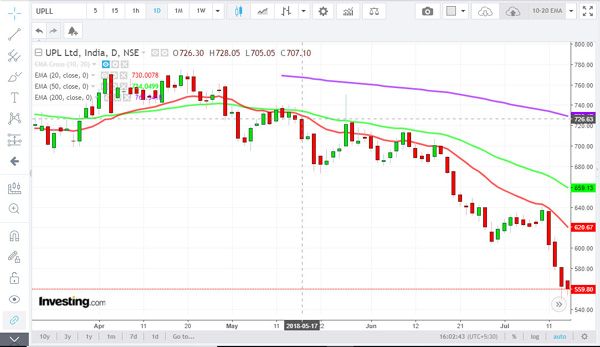
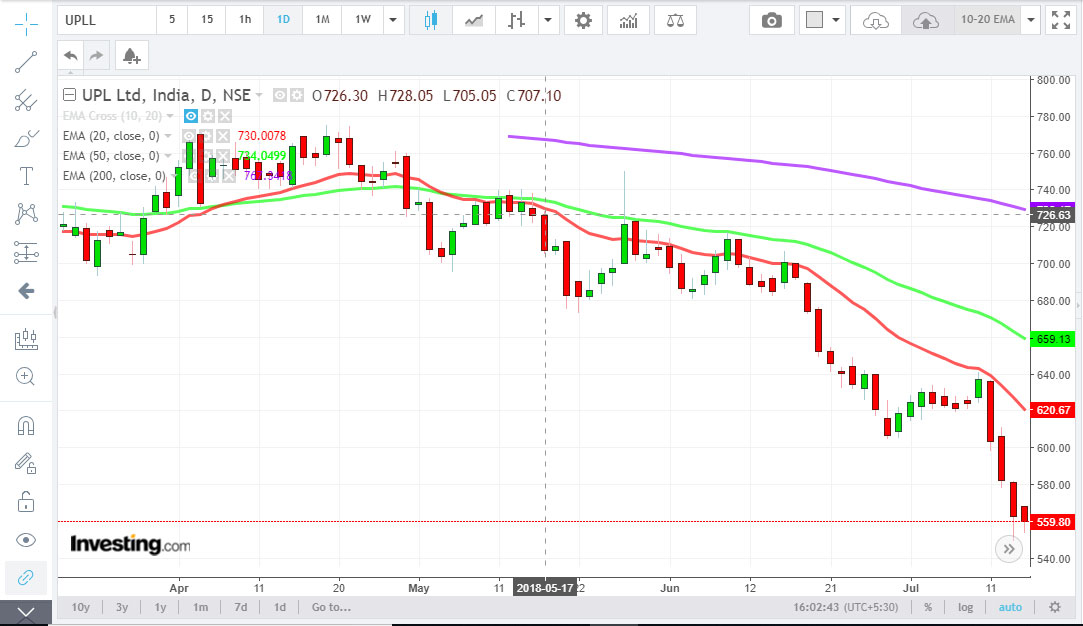
Some chartists use 20,50 and 200 EMAs to confirm the trend. Let’s take an example to understand how:
Here is the 1 Day chart of UPL with the three MAs plotted.

8. Change in Trend
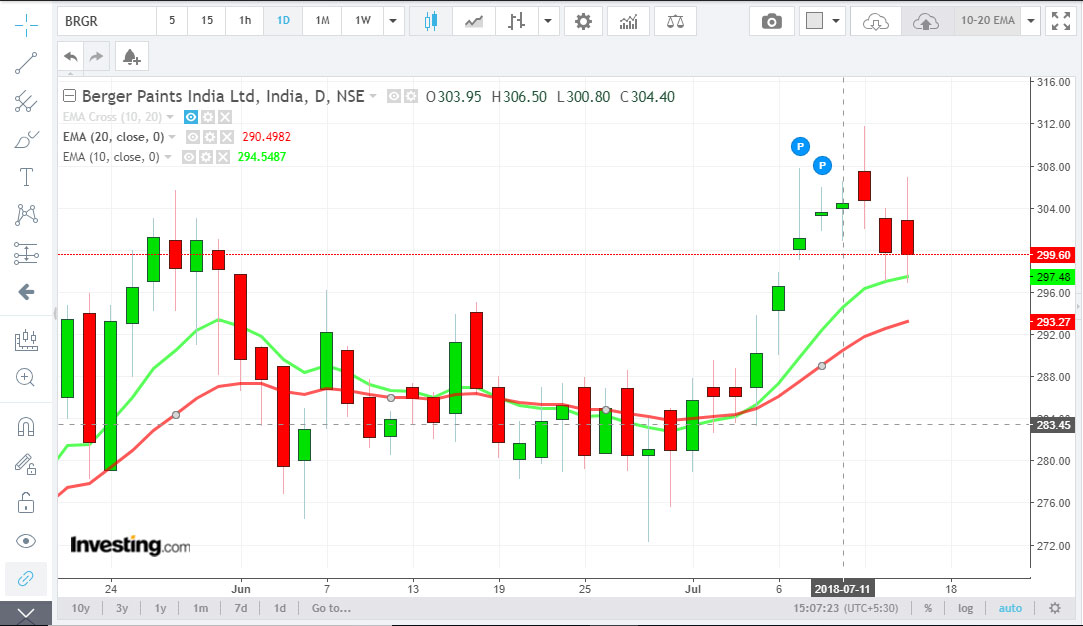
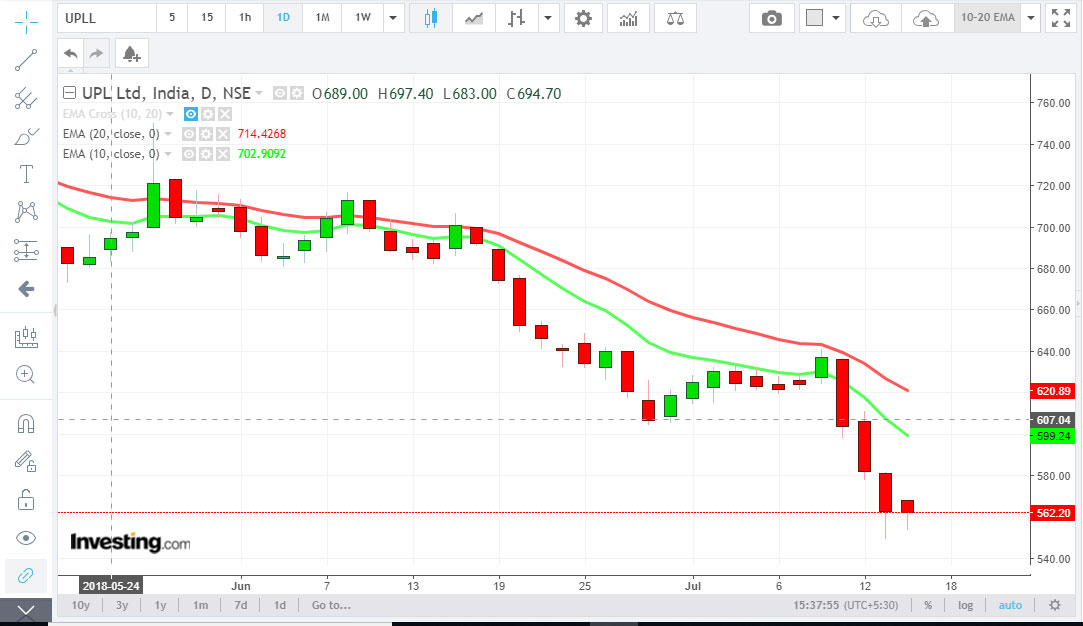
A moving average crossover implies that the trend is changing. 5/8, 5/10, 10/20, 20/50m etc., and many more combinations are used depending on personal preferences to figure out the change in trend.
However, to know of trends that will sustain, you can use higher MAs like 20/50 for day charts, 8/24 for week charts, which are fairly reliable. See there are no hard and fast rules – you should work with whatever periods that have worked for you in the past. I’m biased towards higher averages as I’m a swing trader.
Let’s take an example of UPL again:
8. Commonly Used Moving Average Periods
5/8 EMA, 10/20 EMA, 20/50 EMA, 50/100 EMA and 50/200 EMA are some of the popular periods.
Just remember one important thing – your trading signal is valid for the next 7-12 candles. So if you are using 5 Minute candles, your trade signal is valid for 35-60 minutes, and so on.
You should choose EMA and Time (Candle) periods based on this assumption, combined with your trading style.
9. Golden Cross
When the 50 DMA crosses above the 200 EMA on the daily charts, it is regarded as the start of a monster rally.
10. Death Cross
When the 50 DMA crosses below the 200 EMA on the daily charts, it is regarded as the start of a huge bear phase.
The lesson is watch the 1D chart first, wait for the price t crossover the 20 DMA (either side) and then switch to a lower period 30M or 1 Hour to check if the trend indicated by the crossover continues. If it does, then the stock can be considered for buying or selling.
shoud I switch to 10 ema from 20 ema as period is changed.
Plot 10 EMA to know of any signal in advance. But act on 20 EMA signals
As usual, a brilliant and simple article sunilji.
Dear Sunil,
Indeed it is a good article.
However i had editorial suggestion and query. It would be really great if you can help me.
1) On editorial front, i think there is some mistake in the listing of bullet points. The number 8 got repeated twice.
2) As for my query is as below.
In your point number 8 (Commonly Used Moving Average Periods ) you have mentioned “Just remember one important thing – your trading signal is valid for the next 7-12 candles. So if you are using 5 Minute candles, your trade signal is valid for 35-60 minutes, and so on.”
I want to understand this time validity of candles, but could not get any reference material so as to study the subject in detail. I would be great if you can help me understand in detail or point to some reference material.
The only reference material on the validity of a forecast is personal experience (of different TAs)
Hello Sunil,
Knowledgeabele article, thanks!!
You have used three acronyms in the articles SMA, EMA and DMA. the full forms of SMA and EMA are explained, but no mention of what is DMA. IN the last two sections, you compared DMA with EMA. What should we assume DMA to be?
DMA = SMA