A. WHAT IS TECHNICAL ANALYSIS?
Technical analysis involves plotting the price of a stock, tick by tick, on a chart along with its volumes.
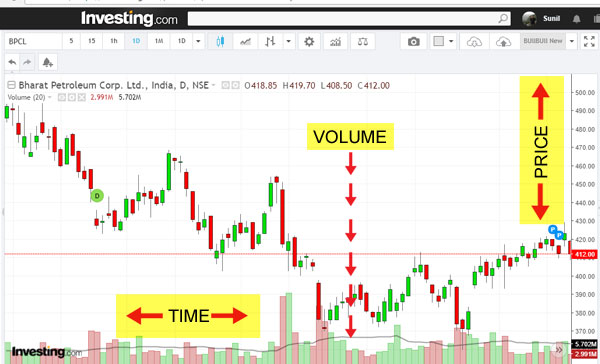
The X axis reflects the time, the Y Axis the price, and the volumes are displayed in a separate section. Check this image out to figure out the elements:

Now, Technical Analysis studies the changes of price and volumes over time.
Mathematicians, stock researchers, academics have created many formulas that extrapolate these elements and provide buying or selling signals.
You may have heard about Moving Averages, Relative Strength Index, Bollinger Bands, etc. – these are the names of different formulas.
Each formula works on all or some elements (price, high, low, change over previous price, volumes, number of periods, etc.) to provide buying or selling signals.
In one sense technical analysis is the study of human behavior in response to fear or greed.
B. What Are Technical Indicators and Do These Work?
Technical analysis attempts to forecast the price movement by applying a formula to the price, volume and time.
This formula is referred to as a technical indicators. As stated above, there are many technical indicators available for free.
No technical indicator is perfect and every indicator does signal a false positive every now and then.
Therefore, it is best to work with a set of 3-4 indicators. If majority of these suggest a buy or a sell, only then you should act.
C. What Should I Study Before Technical Analysis?
It really helps to learn how to interpret OI Data.
D. When Does Technical Analysis FAIL?
Illiquid Stocks
When it is applied to cash stocks. Remember that Technical Analysis works only with extremely liquid stocks that feature in the FNO section because such stocks can be quickly traded without much drama being enacted in the price.
Cash stocks can be easily manipulated and should not be analyzed on the charts.
If you are using charts to study cash stocks, you are playing with fire.
News-Based Events
When unexpected or unpredictable news hits a liquid stock, Technical Analysis does not work. You have seen many examples of liquid stocks such as Fortis, PC Jewellers, JP Associates, Rcom playing out in the recent past.
When good or bad news hits, the stock either gaps up or gaps down and all you can do is watch from the sidelines.
Emotions and Impulse
When you get all emotional and impulsive and act immediately without getting the trading signal confirmed by more than 2-3 indicators.
E. The Time Period On a Chart
F. Minimum Time Period To Be Analyzed on Charts
G. Validity Of A Technical Analysis Forecast
H. Types of Charts

Beginners should focus on 3 basic types of charts and lot bother about others. They can study the other chart formations after developing proficiency in TA.
LINE CHARTS: The closing price per time period is plotted on the chart.
OHLC (Open-High-Low-Close) CHARTS:

Open-High-Low-Close (OHLC) OR BAR charts show the open, high, low and close prices. The image above will help you understand what these imply.
CANDLE CHARTS:
These are easier to understand than the OHLC charts and it is highly recommended that you work with Candles as you begin your TA journey.


I. Volumes
The volumes are plotted below the X-Axis (Time) and this is an important indicator.
For example, a Rs 10 rise in the stock with very low volumes need not imply anything (and vice versa).
However, a Rs 3 rise in the stock price accompanied by heavy volumes can suggest bullishness (and vice versa).
Therefore, it always makes sense to correlate volumes with price.
This post will help you understand how charts are constructed. The next suggested reading should be how to figure out support and resistance levels.
After that, you must understand how candlesticks are formed, and this will simplify your analysis.
You also should read on how to be 100% sure of a chart signal.
All the information above will help any beginner understand the basic construct of charts and know what time periods to apply.
Lovely
Good one.. Great inside for new bees…
Excellent detailed information in simple and easy to understand language! Please keep it up
Please send the same article about technical analysis to my email ID. It was really helpful bcoz I am a bigginer
Cash stocks can be easily manipulated and should not be analyzed on the charts.
sir, I didn’t get the above lines. how do I analyze cash stocks if not by charts?
the article was a good read.
thanks
For cash stocks, use fundamentals. If that cash stock is very liquid, use TA to check trend
This is really helpful
Excellent article. Keep it up. Can u please elaborate on this “This assumption holds true for all chart periods except when you are analyzing Open Interest and Options Data. Action hits the FNO markets first and then spills over to the cash market. Therefore, if you are acting on FNO data and technicals, know that price action may take 2-3 days to spill over from the FNO to the cash market.”
Would be grateful
https://bullbull.in/market-iq/how-to-analyze-open-interest-data-and-generate-profitable-swing-trades/
thank you very much for enlightening me in TA
Excellent.pl advice 3 to 4 indicator for position al basis on daily chart.thanks
https://bullbull.in/charts/a-live-trade-setup-that-can-generate-super-profits/
Dear Sir, ThanQ so much for this Basic Course, Sir do you manage PMS or provide F&O account management service? Kindly let me know if you do so sir
Thanks, Prabhakar. I don’t manage PMS or provide any account management services.