Before anything, know that swing trading is a short term trading strategy and you should have enough capital to hold stocks from anywhere between 2 days to 6 weeks. This is if you are going long.
You also can short, but please work with strict stop losses and be quick with your trades. Try ad book out intra day.
If your idea is to use this strategy for intra day trading, it will NOT work.
So be ready for that.
ESSENTIAL READING FOR WANNABE SWING TRADERS
- Before swing trading, you will have to learn how to analyze open interest data. Here is a guide that will help.
- You also will have to learn how the MACD works. Here is a MACD indicator guide.
- Finally, I urge you to glance through a trading setup that can help you generate profits. Here is the post.
Please read and absorb all the materials before going any further.
UNDERSTANDING CHART TIME FRAMES USED FOR SWING TRADING
A swing trader typically checks 3 time frames:
- ONE WEEK for understanding overall trend (time period to check – 4-5 months)
- ONE DAY for understanding short term trends (time period to check – 5-6 weeks)
- ONE HOUR for entering into trades (time period to check – 3-4 weeks)
SUGGESTED TECHNICAL INDICATORS
I use the following indicators:
a. Ichimoku Cloud
b. Supertrend
c. MACD
You can set up these on the charts at Investing.com or elsewhere, or you can work with any indicators that you are comfortable with. There are no hard and fast rules.
The suggested indicators have been discussed in the reading material prescribed above.
WHAT’S THE RIGHT TIME TO START FIGURING OUT POTENTIAL STOCKS?
I’m assuming you have read the articles posted above. Without reading or understanding those, you will not be able to figure out how to identify stocks that make for good swing trades.
In Choppy Markets: About 12.30 PM to 1 PM is a good enough time because trends take time to stabilize
In Trending Markets: You can start as early as 10.30 AM to 11 AM
You also MUST check EOD Open Interest Data which gives you a clearer and better picture.
Last evening I came across heavy OI + Volumes buildup in Godrej Consumer Products and tweeted about it:
Track Godrej Consumer Products tomorrow on the charts.. it is likely that it will break resistance if markets are steady or up. The chart is #3 out of 4 charts. pic.twitter.com/OuIliLiEjp
— Sunil Tinani (@TheBullBull) May 23, 2018
At EOD yesterday the CMP was 1101.
In my opinion, it makes for a good swing trade because of high OI buildup.
Let’s check the OI now at 1.30 PM on 24-5-18

The price is up 0.34%, OI is the same as yesterday, and volumes have yet to pick up.
However, it is 1.30 PM now and we still have 2 hours to go. Moreover, the price has appreciated from 1101 to 1108. Therefore Godrej Consumer Products is a conviction pick for a swing trade.
CHARTS CHECK
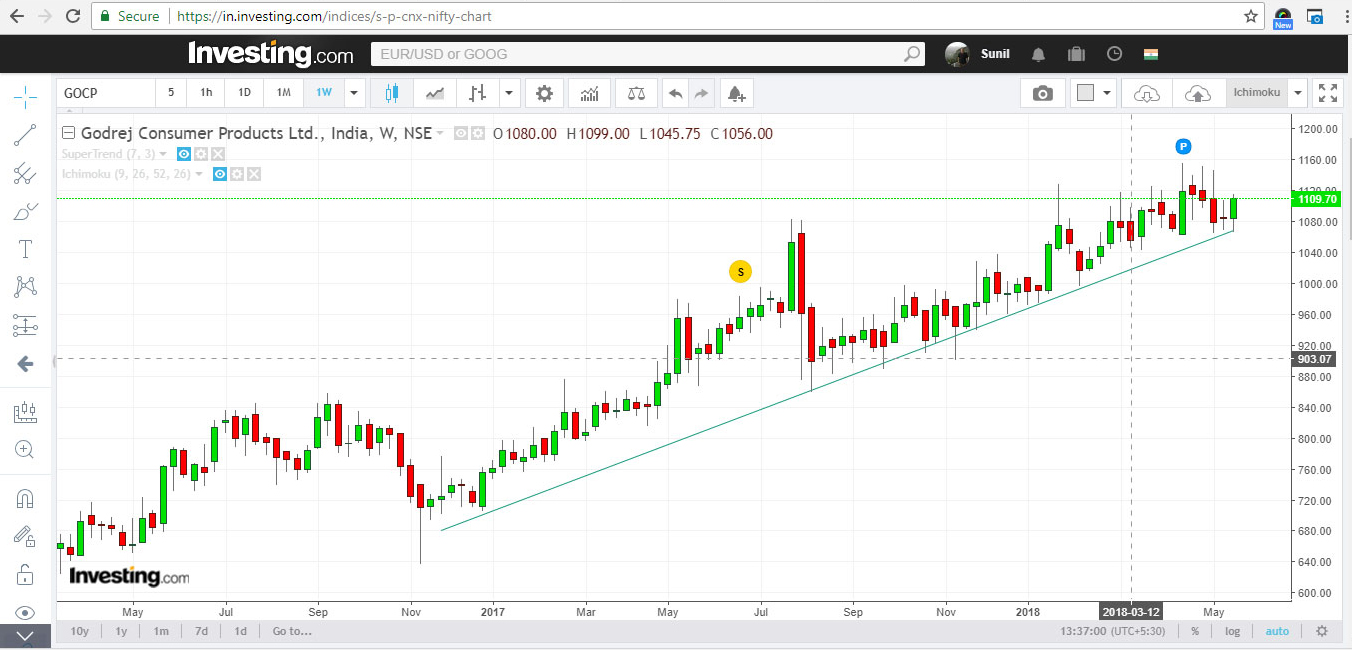
WEEKLY CHARTS SUGGEST AN UPTREND
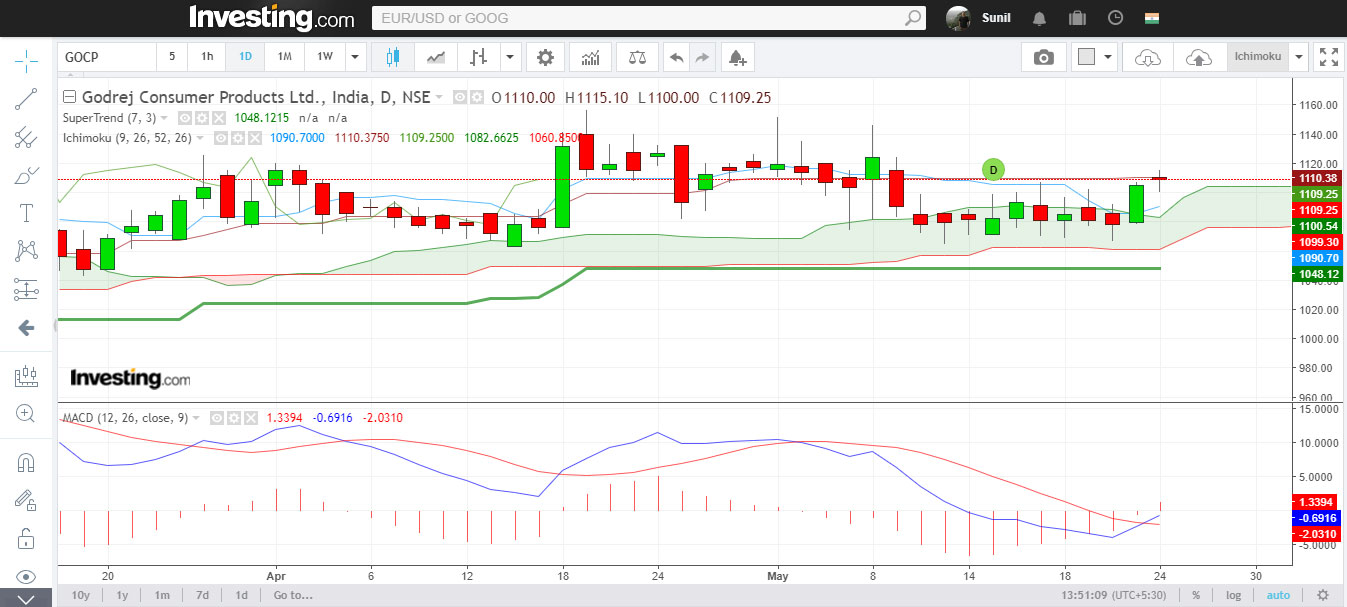
DAILY CHARTS:
Supertrend – Bullish
Ichimoku – Bullish
MACD – Super Bullish (MACD line crossed Signal Line below Zero Line)
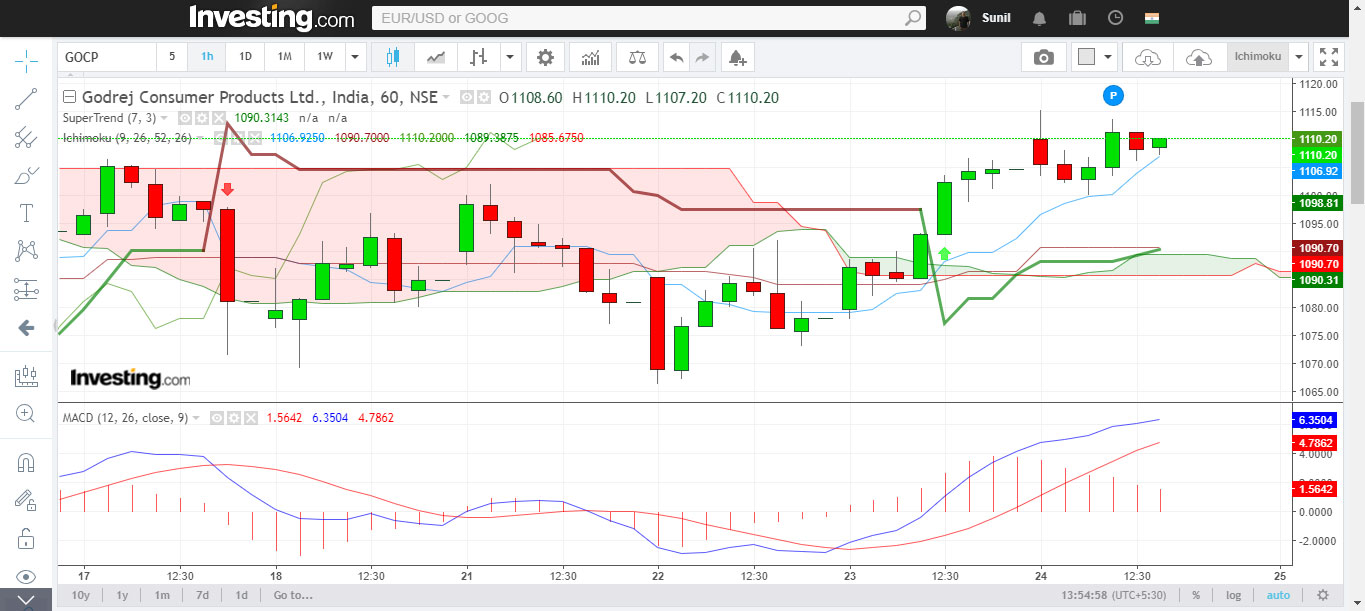
HOURLY CHARTS:
Supertrend – Bullish
Ichimoku – Bullish
MACD – Bullish
ALL THREE CHARTS CONFIRM THAT GODREJ CONSUMER PRODUCTS IS IN A BULL ZONE. BASED ON OI DATA IT MAKES A GOOD CANDIDATE FOR A SWING TRADE WITH THE SL AT 1090 (the Ichimoku and SuperTrend supports).
Put this guide into practice. Enter into a few paper trades, convince yourself abut the efficiency of this strategy, and only then enter into a trade.
Let’s also review the price of Godrej Consumer Products in a few weeks and see if we’re right.
Sir
as per todays data I have sorted KPIT for swing trading.Please guide me
Correct. Had you checked the data at 11.30, you would have got it at 2% over yesterday’s close and had you bought, you’d have made 2.5% on your investment.
Thanks for step by step selection process for swing trade. Appreciate the process and clarity. Will try out in paper.
Seems very interesting article will go through learning guide in details.Pranaam.
Thanks a lot sir. God bless u 🙂
Hi Sunil,Thanks for writing articles if always help us.
what if all these trends contradict in terms of hourly,daily and weekly chart.
Supertrend – Bullish
Ichimoku – Bullish
MACD – Bullish
Sir, How to check this setup. Any screener or check one by one.
Use a screener.. Chartink is good
Very nice Multiple Time Frame Analysis (MTF). Sir MTF analysis adds value and improves chances of success.
Many thanks for article. Good learning.