Here is a complete and comprehensive guide on how to access line Open Interest data, analyze it and generate profitable swing trades.
Stock Exchanges measure Open Interest (OI) as a number that represents outstanding (open) Futures and Options (FNO) contracts.
Outstanding contracts of any stock or index as measured as follows:
Outstanding Contracts in futures trades
(+)
Outstanding Contracts in Call Options at different Strike Rates
(+)
Outstanding Contracts in Call Options at different Strike Rates
=
TOTAL OPEN INTEREST IN THAT STOCK (OR INDEX).
The OI is calculated for one side (Long or Short)
A. Example of How Outstanding Open Interest is Measured
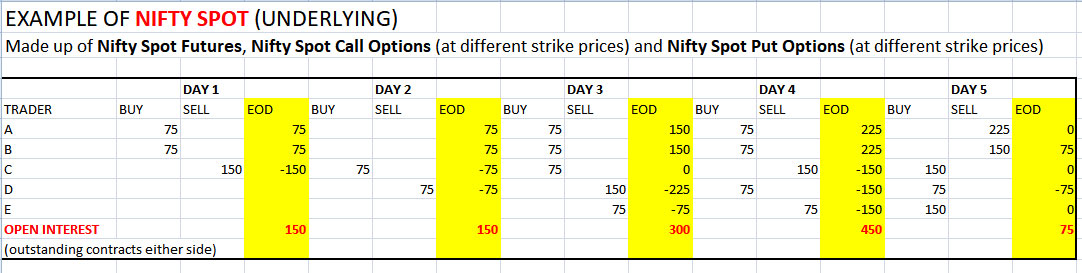
Note that when you take the net position, it is always ZERO because for every buyer there is a seller. But OI is calculated as the number contracts outstanding on either side.
Buyers and sellers keep squaring up their positions before expiry and therefore the open interest keeps on fluctuating (rising or falling) every day.
B. OPEN INTEREST PERMUTATIONS (and their interpretation)
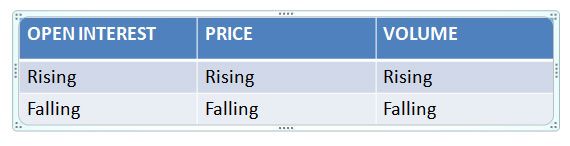
Here’s how you analyze the different permutations:
- OI RISING, PRICE RISING, VOLUME RISING
Buyers are chasing the stock making the price rise. The OI too is building up and the volumes too are increasing.
THIS IS A BULLISH SIGNAL - OI RISING, PRICE FALLING, VOLUME RISING
Sellers are hammering the stock, making the price fall. The OI is building up and the volumes too are increasing (both indicating an increase in shorts).
THIS IS A BEARISH SIGNAL - OI FALLING, PRICE NEUTRAL OR FALLING, VOLUMES FALLING
It implies that bulls are squaring up positions leading to a fall in prices. However, volumes too are dropping and therefore the downside can be limited.
THIS IS A SIGNAL TO TRACK THE STOCK because once the selling is done, it can move either way, with a higher chance of it moving up. - OI FALLING, PRICE RISING, VOLUMES FALLING
It implies that bears are covering shorts leading to a rise in prices. However, volumes too are dropping and therefore the upside can be limited.
THIS IS A SIGNAL TO TRACK THE STOCK because once the short covering is done, it can move either way, with a higher chance of it moving down.
Restrict your trading to these signals, and preferably, stock to 1 and 2.
NOW REMEMBER, Do NOT act on OI Data without checking a special technical setup that I have crafted for you. This will follow after a few sections.
C. Where to Access Live Open Interest Data
MoneyControl is the best source where you can check OI data per sector. Remember to browse stocks in each sector. This link will take you to the auto sector and from there on you can use the drop down.
The second source is the NSE website which does provide helpful information but does not report increases in price and volumes, (which you will have to manually verify). Still it’s a good tool.
D. What Time To Access OI Data
The data gets more and more meaningful as the trading day passes by, and you should ideally start checking data from around 12 PM and check it every 15-30 minutes right till the end of the trading day.
You are looking for:
A decent rise in OI (above say 8%-10%) with rise in volumes and an okay rise in price (you don’t want to chase stocks that have risen like crazy, so look for 2%-4% increase in price).
A decent rise in OI (above say 8%-10%) with rise in volumes and an okay fall in price (you don’t want to short stocks that have fallen like crazy, so look for 2%-4% drop in price).
REMEMBER: You will get no more than 1-3 bullish or bearish stocks everyday. These stocks are good for swing trades (trades that can stretch from 1 day to 4-5 weeks).
E. What to do after identifying the stocks that are eligible for swing trading
Even though the OI data suggests a buy or a sell, you must check what the indicators tell you.
Therefore, set up 3 indicators in your charting software or at Investing.com.
a. SuperTrend
b. VWAP
(you can read more about the first two indicators here)
c. Accumulation/Distribution: This is an important indicator because it tells you whether the stock is being accumulated (bought) or distributed (sold).
It has a zero line. When the indicator is below the zero line, it means distribution is taking place, and when it is above the zero line, it implies investors are buying.
Now when when the Accumulation-Distribution line reverses its trend, you must track the stock.
For example, if a stock is lagging and the accumulation-distribution line starts moving up towards or crosses the zero line, it means strong hands are buying the stock irrespective of how the price moves. And vice versa.
This is an extremely important indicator that you must set for any stock that you identify.
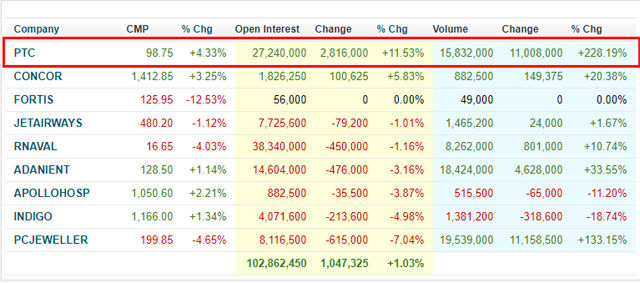
So, on Sunday night when I started writing this article, I found that PTC was generating a lot of interest and the OI data looked bullish.
But I did not act. Instead I checked the charts (The 1D candles because the stock was to be bought for a swing trade) and found that:

Here’s what I saw and concluded:
- Candles were red right from the opening.
- SuperTrend signaled a sell when the price was 95.
- The stock was way below its VWAP.
- Though the stock was in an accumulation phase (above zero line), the line was falling.
All these factors made me stay away from the stock. But you should keep on watching the PTC charts for signs of reversal. And if the accumulation line starts getting stronger, you should then check the OI and consider it for a swing trade.
And this is exactly what you should do once you identify stock.
F. Analyzing Open Interest Data
It’s 14-5-18 and around 3.20 PM.
To write a live article I would start watching OI data from 12 PM. However, I have gotten late and at 3.20 PM, here are a couple of stocks that look good for a swing trade:
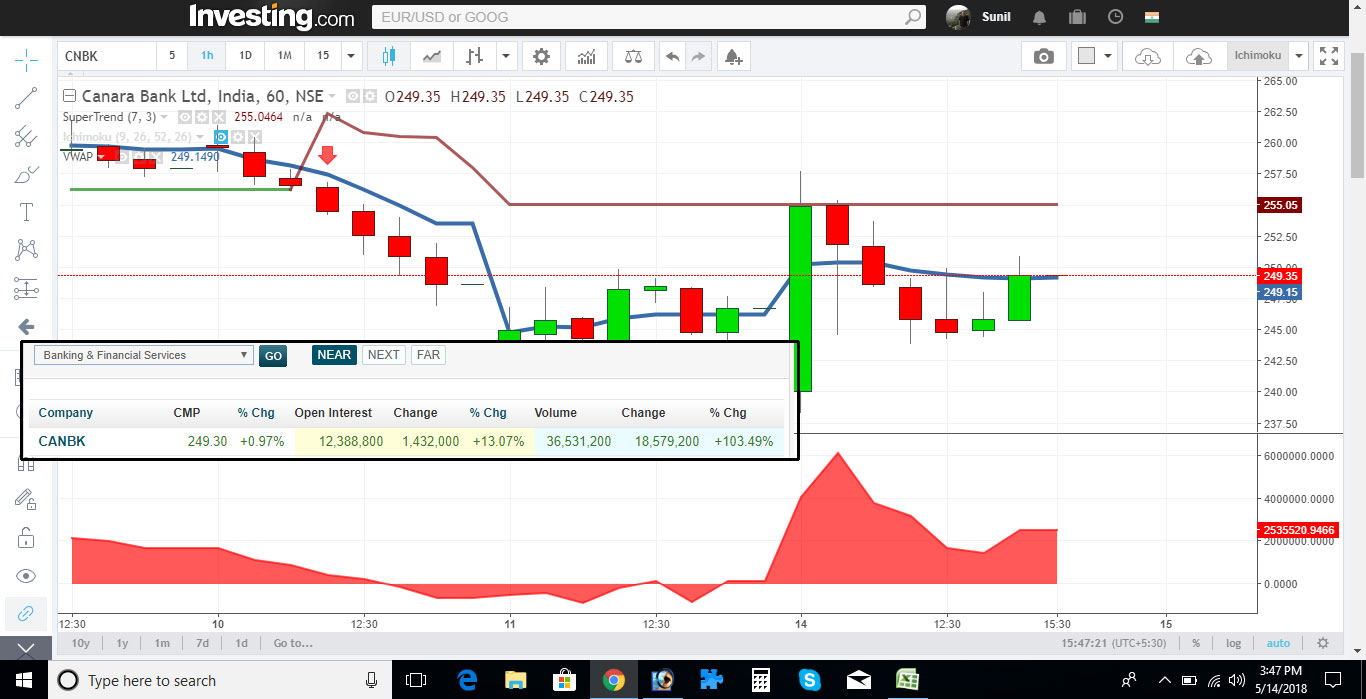
Canara Bank: 13% increase in OI, 103% increase in volume and 1% increase in price. This should be on your watchlist.
It is is accumulation zone and is the accumulation line is steady. Any spike in price can be a sign of bullishness. I would watch Canara Bank.
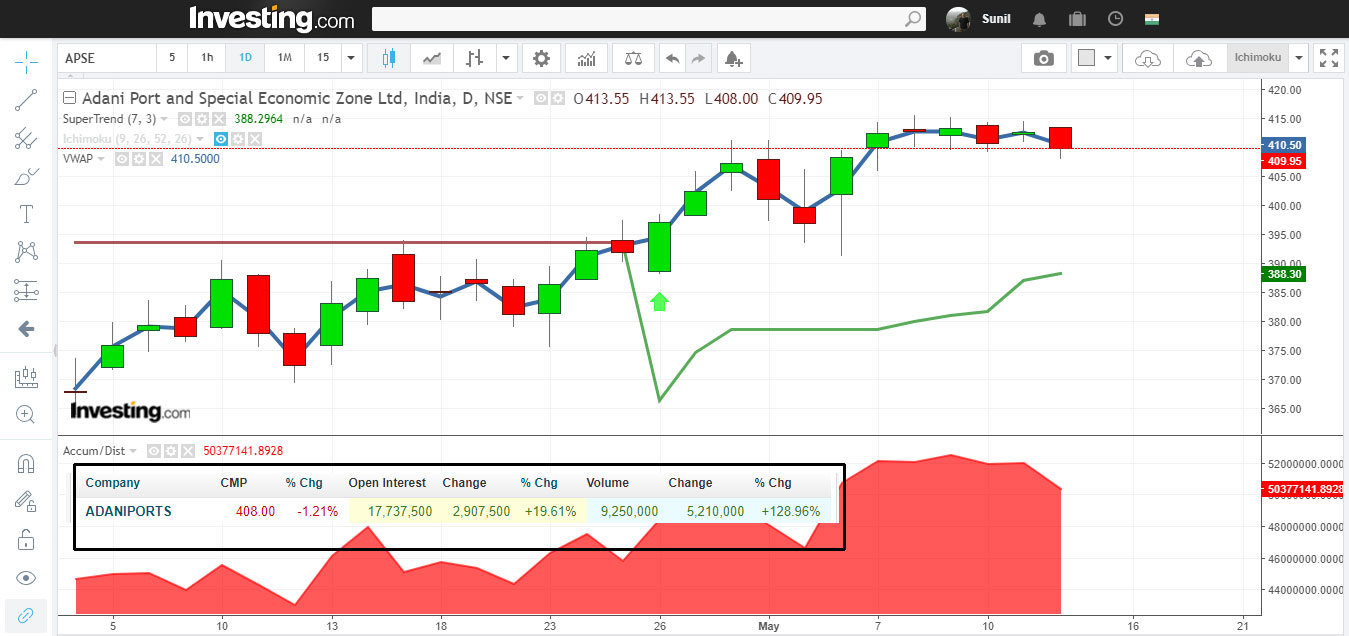
Adani Ports: 19.6% increase in OI, 124% increase in volumes and 1.21% fall in price. Given Adani’s political connections and the sword of elections dangling over India, it does seem that the stock will now be volatile.
Though positive, the accumulation distribution line has started falling. I would watch this stock and if the accumulation-distribution line starts dropping, Adani Ports could be a shorting candidate.
So, well, this is how you interpret OI data, apply technicals to your picks and then act. Of course, I did an EOD study today, but would urge you folks to start checking OI data from 12 PM onwards to figure out a couple of profitable swing trades. Good luck.
Too good sir
Sir i think this is better link for Money Control OI Data . https://www.moneycontrol.com/stocks/fno/marketstats/futures/oi_inc_p_inc/homebody.php?opttopic=allfut&optinst=allfut&sel_mth=1&sort_order=0 .
Nice article Sunilji, a bit correction,it has to be PUT instead CALL on second time
Outstanding Contracts in Put Options at different Strike Rates
Extremely well explained!! Thanks a lot for enlightening the readers.
SIR, IN PTC INDIA CHART U HAVE MENTIONED 1 DAY CANDLE WHEREAS CHART IS SHOWING 1 HOUR CANDLE.
OK, will correct.. thanks
Interesting article Sir.. I have a query.. When u mention that “OI RISING, PRICE RISING, VOLUME RISING” and so on… is it for 2 days data or 3 days or more… I mean how long shud we see this pattern to get indication that one sided move can come in
1 Day spike should indicate that something is up
I presume that OI for the near month contract has to be seen… Is there any relevance of the OI data for the next month contract??
Regards
All contracts are built into the OI
For how many days observations or data is necessary to confirm rise or fall of open interest and price to judge swing direction along with other parameters
Keep checking daily and confirming with technicals. If both signs look good, enter
Hi Sunil, I am holding India Cements May Futures, and I am looking at the OI’s. As per 18 May closing, India Cements price down by 3%, OI up by 0.17% and volumes up by 13%. The Supertrend for both 1 and 3 month is negative, which is price is 5% to 8% lower than the supertrend values for 1 and 3 months. The closing price is also below the VWAP on a 1 month chart / 1 hour candle. What is the inference, is it very bearish
Hi Sunil, I am holding India Cements & Coal India May Futures. I have analyzed based on your OI article and my comments are below;
India Cements
As per 18 May closing, India Cements price down by 3%, OI up by 0.17% and volumes up by 13%. The Supertrend for both 1 and 3 month is negative, which is price is 5% to 8% lower than the supertrend values for 1 and 3 months. The closing price is also below the VWAP on a 1 month chart / 1 hour candle. ADX: -DI is going significantly over +DI on 1 month timeframe and hourly candle with ADX value of 17. What is the inference, is it very bearish
Coal India
As per 18 May closing, Coal India price down by 2%, OI down by 2% and volumes down by 48%. 1 month Supertrend is below 18 May closing price and 3 month supertrend is above closing price. The closing price is also below the 1 month VWAP. ADX: -DI is going over +DI on 1 month timeframe and hourly candle with ADX value of 22. What is the inference, is it very bearish, or since as per OI since price, volumes and OI’s are falling, there will be a turnaround and bounce back of prices
Your suggestions and analysis will be very much appreciated
Very good article, I have a query: After analysing the open interest data and identification of stocks what time frame should be used for the charts for technical entry. The time frame can vary or entry should be based on a particular time frame.
One hour or 1D..
How do you check the % change in volume, do you compare it with previous day volume or average of previous 5 or 3 days.
Dear sir
It was very useful information…
Thankzzzz a lot for sharing valuable information and spending your valuable time…
Hope it will be helpful to all traders and for me also
It was very simple to understand and technicals also
Regards
ANJAN
Thank you for the interesting post Sunil ji. Appreciate the same. I have following queries on Accumulation/ Distribution as below:
1. In case of Adani chart in your post, during the month the A-D has exhibited a downward slope multiple times and then this slope got reversed. So if all other indicators suggest a trend and the A-D starts sloping downwards, should v take an action or will it be safer to wait and take action when A-D line is closer to “Zero” line and seems ready to go on the other side ?
2. For swing trades and for someone who can only give time to look at EOD data, what data points should we monitor ?
Thank you for your kind help.
regards
Sourabh
Adani is a political stock and the promoters keep buying it from the open market and keep pledging it. I suggest that you avoid news based stocks because the charts can generate a lot of false positives or negatives.
For Swing trades you should look at live data starting from 11 AM and checking every 15 minutes. Data points to monitor would be high OI buildup in excess of 7-8% and a reasonable rally in price by 1-2% because you you don’t want to jump into stocks that have appreciated more than 5-10%
What can I understand when OI rising PRICE rising and VOLUME falling…. Please let me know
In that case, ignore the stock because volume action is very important and falling volume implies lack of interest in the stock.
Sir nice article. Very informative. Thanks
Sir, how about a scenario where price is up 4%, OI is down 1.23%, volume up by 43%. What will be decipher here?
Minor profit booking
Sir, do you personally mentor or teach retail traders? If yes how can i contact you?
I will be starting this shortly
Hi Sunil,
Does the Volume here refer to the Futures Volumes or the Cash Volumes?
Does the change in prices here refer to the Futures Prices or the Cash Prices?
And what timeframe should i use to confirm on the chart to buy/sell?
thanks.
Cash prices and volumes
Use 1 Hour time period
Sir u you say decent rise in volume..Can you please let us know by your experience how much percent rise in volume should we consider.
Say 25% to 30% rise over previous day
One query …VWAP on daily charts on investing.com does not show the correct price and above that is VWAP a purely intraday indicator..Thanks
Do y personally teach technical
Am starting in November. Stay tuned.
sir, have seen many stocks where Price is down, OI is up 3-6% and volume is down. What is interpreted out of it? Ex- Reliance down 2.66% OI up5.41% and vol down 11.15%. Same with SunPharma.
You need to monitor OI data continuously. If OI is 25% in the morning and 5% in the afternoon, it implies people are squaring up positions.
If price is down and volume is down despite OI being up, it can imply lack of buyers or inactivity.
fantastic post….thanks
Sir,
Very nice and informative articles… Can same thing apply for Bank Nifty and Nifty
Yes
Hi Mr.Sunil. Your article on Fno data analysis titled as ” How to Analyze Fno volumes..” very informative. At the end, you didn’t continue with more scenarios. Pls, can you brief on all scenarios. Also, can you suggest books on same will be helpfull.
Sir,
Nice article and informative too.
Informative and Useful, Thank You, Sir!
DEAR SIR,
NO ONE TEACHES THEIS TOPIC VERY EASILY TO UNDERSTAND BY LAYMAN LIKE ME.
VERY VERY USEFUL. GOD BLESS YOU AND YOUR FAMILY, SIR.