Many of you folks who are fascinated by option writing must first know that it is a complex game that requires speed, discipline and nerves.
It is not a game that everyone can play.
This setup is for you folks to practice on paper and understand the nuances. Know that it can take you more than a month to get the grasp of how options tick.
GENERAL RULES OF THE SETUP
1. This setup is for learning purposes.
2. Option writing is a risky game, and therefore this setup holds good for between 15 minutes to the end of the trading day. Positions must not be carried over.
3. Positions must be monitored continuously.
4 SLs must be followed strictly.
TECHNICAL INDICATORS FOR THIS SETUP AND THEIR INTERPRETATION
1. 10 Period EMA: Use it to figure out the trend for the day. If the price remains above it, the trend is bullish, and bearish if the price remains below it.
Any price crossovers should be interpreted as change in intra-day short term trend, either bullish or bearish, as the case may be.
This price-10 EMA crossover
2. VWAP: Use it to confirm the 10 EMA signals. Same interpretation as the EMA.
3. 50 Period Simple Moving Average:
If 10 EMA crosses above it, trend has turned bullish, and will remain so for some time
If 10 EMA crosses below it, trend has turned bearish, and will remain so for some time
Same interpretation for any price crossovers.
Know that the signals generated by crossovers from 50 DMA will linger for a longer while than the crossovers from the 10 EMA.
4. Directional Moving Index (DMI):
Firstly, please know how the DMI works.
If you have read the article linked above, you will be aware that when the DI+ line starts moving up, it indicates a bullish trend, and when it falls, it is a bearish signal.
When the DI- line starts rising, it indicates a bearish trend, and when it falls, it is a bullish signal.
The black line is the ADX (Average Directional Index) line. It indicates the strength of the trend. If it crosses above 25, the trend picks up strength, and if the ADX keeps rising the trend keeps getting stronger.
So, if the DI+ line is above the DI- line and is rising, and ADX rises too, it means the bullish trend is getting stronger,
If the DI- line is above the DI+ line and is rising, and ADX rises too, it means the bearish trend is getting stronger,
And, vice versa.
2-3 indicators must be used to confirm the trend before you enter into a paper trade.
Only Out-of-the-Money Options must be written after reading the indicators’ signals. The closer these are to the expiry, the better, because the time will keep decaying the premium.
As this guide requires you to square up positions intra day, you should work with 15 minute and 30 minute candle charts. At the maximum, you can work with 1 Hour charts, but then you will miss out on many trades, and perhaps enter late.
Do not be in a rush and start writing options at the open. Wait for the trend to set in. You should watch till around 10.30 to 11 AM and then decide if the trend has set in. Sometimes you will get a trade very late, perhaps after 1 PM.
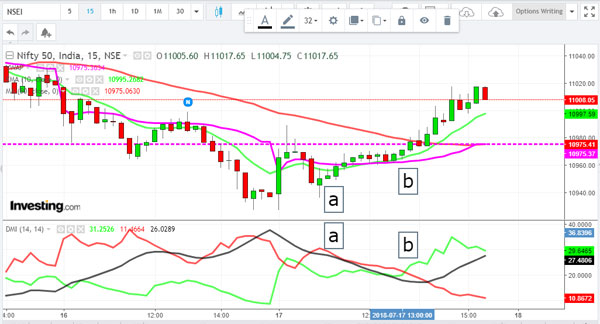
Example of Option Writing of Nifty 15 Minute Chart on 17-7-18
The Nifty gave 2 chances today to write Put options (PEs) and both chances would have resulted in solid gains.

(a) At 10.45 AM when the NIfty was at 10950, three indicators turned bullish:
— the DI- line started falling
— the price crossed above the 10 EMA
— the ADX line started falling indicating a weakening trend (at this time the DI- was above the DI+ line and the ADX line falling indicated the bearish trend was weakening)
— the price crossed above the 10 EMA, 50 SMA and VWAP (a few minutes later)
At this time pro options writers would have written out-of-the-money PEs.
As you can see the Nifty kept gaining strength and moved quickly from 10950 to 10975. It is a no-brainer that handsome gains would have been made at this point.
(b) At 1.00 PM when the NIfty was at 10955, the rally gained steam and all indicators turned bullish:
— the DI+ line crossed above the DI- line.
— the ADX line started siring indicating a trend that was gaining strength (at this time the DI+ was above the DI- line and the ADX line rising indicated the bullish trend was strengthening)
— the price crossed above the 10 EMA, 50 DMA and VWAP
At this time pro options writers would have very aggressively written out-of-the-money PEs.
The Nifty kept strengthening and moved from 10975 to 1100 and the move would have made money for options writers.
All positions would have been squared up by the end of the day.
Okay, this looks easy on the face of it but is not as simple as you think it may be. It requires practice and discipline. Try out the setup on paper and check if it works for you. Maintain a Excel sheet and log in your profits and losses. Review after a month. Do not enter into trades until you are sure of yourself.

sir can this strategy be traded on futres also for intraday ???
Intra day only
Sir, how to contact you..?I need help from you.. Plz mail me your contact details…
Please use the Contact form in the About Us page
Sir can you tell me candle stick setup for futures and cash trading for this indicator in intraday
I’ve tried it on Futures, but it gets very dicey. Best to apply indicators on cash rates and trade in Futures
Thx for sharing the knowledge,and it works absolutely 100% and I had profits using this,but new to the options I didn’t book full profit exited in the midway however I had no regrets of it…..yesterday’s axis 580CE and ITC 305 CE are the perfect trades for me using this strategy…
Sir
This strategy works index options too like NIFTY & BANK NIFTY. Please suggest.
Do paper trades and try
Yes, it should. Try paper trades.
Good article.Thanks for educating us.
Sir, if its intraday why write options. Isn’t better to buy options?
Buying is better than writing, I agree