Volume Weighted Average Price (VWAP) is the average of the price and the volume.
It is an extremely important indicator that helps traders and investors gauge the trend and understand whether they bought or sold a stock at the right price. It also helps traders enter into profitable trades.
To understand how VWAP is calculated, let’s take an example:
Stock opened at 10 in the morning and is currently quoting 8 bucks (let’s say, buyer at 7.75, seller at 8.50).
So, as per charts it will show a sharp fall of 20% (from 10 to 8) and perhaps some indicators will signal a sell.
But, let us suppose the price movement went like this:
50,000 shares traded at 10
5,000 shares traded at 9
2,000 traded at 8
The VWAP will be calculated like this:
50,000 X 10 = 5,00,000
5,000 X 9 = 45,000
2,000 X 8 = 16,000
Total: 57,000 shares traded for 5,61,000
5,61,000 divided by 57,000 = 9.84. This is the VWAP.
Remember that different formulas may be used, but the end result is more or less what you read above.
So, the VWAP in this case is just 16 paise away from the opening price of Rs 10, whereas you will see a sharp dip on the charts (from 10 to 8) and possibly rush in to short the stock.
However, a VWAP watcher will not short the stock at 8 even if he is bearish.
Here is another example for better understanding:
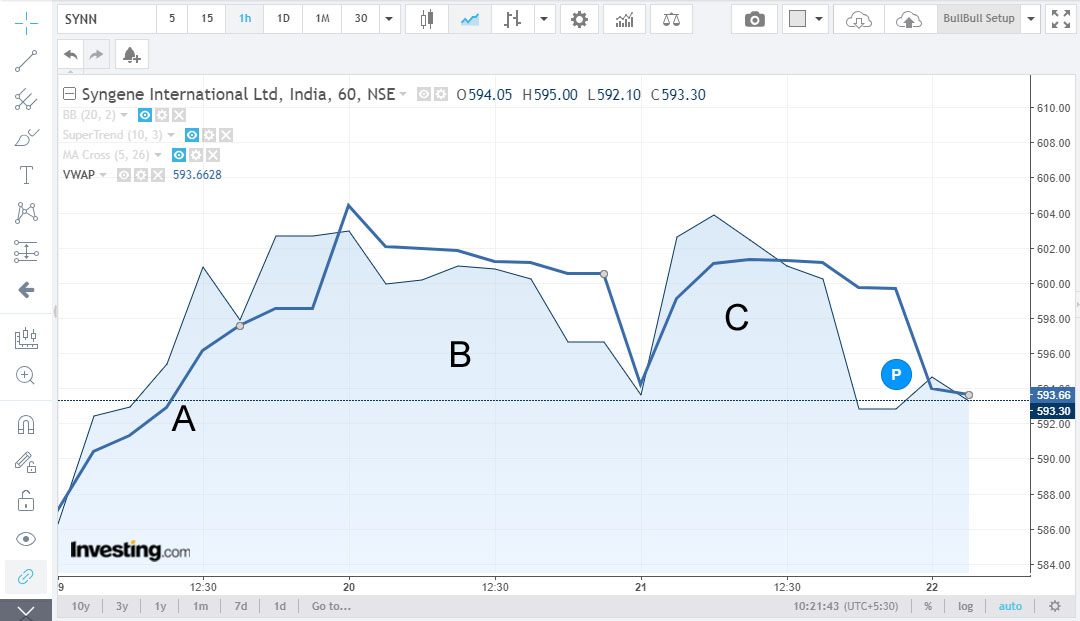
This is the Syngene chart. The dark blue line is the VWAP.
Here is what we can observe and conclude:
Phase A: The price moved above the VWAP and later fell to meet the VWAP.
Phase B: The VWAP started rising and so did the price initially. Later the price started falling and so did the VWAP until both reconciled.
Phase C: The VWAP and price started rising but the price remained above or below the VWAP until both the values reconciled.
Advantages of using VWAP
- It helps traders cut through the noise generated by highs, lows, open, close, and 0ther candle formations, and benchmark the current price to the VWAP.
- The traders can figure easily out whether the volumes are being picked up (or sold) at low or high prices. He can figure out this information in just one glance.
- It helps traders buy or sell at the right price (the VWAP) instead of jumping into a trade at current prices.
- VWAP especially helps large traders such as MFs and institutions trade at an optimum price.
- Bulls and Bears can use VWAP to enter into intra day profitable trades.
VWAP Interpretation and Trading Strategies
- When price crosses above VWAP and the volumes are significant, it implies that bulls are in control (BUY if the volumes are significant).
- When price crosses above VWAP and the volumes are insignificant, it implies that the price may be being pushed up (Consider a SHORT if the volumes are insignificant).
- When price falls below VWAP and the volumes are significant, it implies that bears are in control (SELL if the volumes are significant).
- When price falls below VWAP and the volumes are insignificant, it implies that the price is being dragged down (Consider going LONG if the volumes are insignificant).
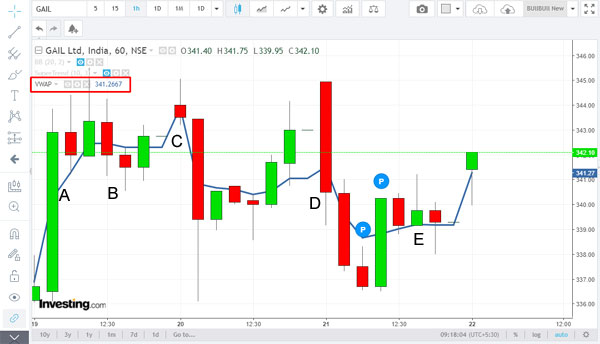
To understand these signals, let’s analyze this 1 Hour Chart of Wockhardt.

A – Price moves below VWAP and volumes are significant (SHORT)
B – Price moves below VWAP and volumes are not significant (AVOID)
C – Price moves below VWAP with good volumes (SHORT)
D – Price moves above VWAP, volumes are significant, and selling is rejected (candle) (LONG)
E – Price moves above VWAP and volumes are insignificant (AVOID)
F – Price moves above VWAP and volumes are good (LONG)
This is all you need to know about VWAP.
I think he is the best master of TA for me.
Nice study sir… Every tweetis a lesson….thanks
Too good and very easy to understand. Thanks sir
Thanks sir for sharing valuable information.keep doing good work
Sir, can VWAP be used for illiquid stocks too ? Also, let us know how to identify illiquid stocks.
It can be used to detect insider buying or selling, but not for fresh entries, because illiquid stocks can be easily manipulated. So, high VWAP one day can become low VWAP the next. For proof, you can check SMS stocks.
Thanks sir for your valuable information and insights.
Good post sir. Everyday I read a new lesson from you. Please continue doing it for us.
I checked it on chart of Vedanta dt 21st & 22nd Jun, 18. Not working.
It’s because the price moved in a narrow range between 227 to 230. In such cases you obviously won’t get any signal
The above info was very useful and in simple language. Thanks Sunil.
Can VWAP be used for Intra day trading in cash / Margin trading ? If yes kindly help.
Don’t recommend using charts in cash stocks unless these are very liquid and not prone to circuits
Thanks sir
If I am understanding correctly.. we shouldn’t consider the VMAP signal for any stock having abnormal movement right? Also for the cash stock
For cash and illiquid stocks you can use it to check if accumulation or distribution is happening
For FNO and very liquid stocks it can be used irrespective of abnormality, but avoid stocks in the news like PCJ, HCC
What timeframe works best for VWAP for intraday
Flip between 5M-30M to know VWAP trends
Hi Sir, How to confirm weather the volumes are significant or not significant looking at the chart.
Look at the black line in the volumes bar. If the actual volumes are significantly lower than it, you can ignore
Sir, can this be used for Call and Put options of Nifty?
Use DMI with VWAP for options.
If price below VWAP and DI+ falling, write OTM call options near expiry
If price above VWAP and DI+ rising, write OTM Put Options near expiry
and so on
Sir, what is DI+?
Sir, one more question pls. I am watching live Nifty chart, the price is below VWAP but how we identify that whether volume is more or less at that point of time? But after a gap I see that there was a substantial volume during the period.
Sir, I was watching NIFTY live chart for couple of days on Investing.com, the chart shows for last 1 hour, 15 min, 5 min etc, based on past time frames of 15 min or 1 hr we have to take the current position? Is this the understanding correct?
Lower timeframes work better while using VWAP because prices equal VWAP over longer periods
Thank you for an excellent article sir, when you mentioned about the black line in the volume section is it a Technical indicator you used or what line is it it sir?
Kindly let us know
20DMA of volume
Sir, is the vwap same as ATP shown in trading terminal?
Yes, it is
Sir, Basic question:
When we go to hourly chart, i think the chart automatically changes to 20 HMA (Hourly moving average). Am I right??
Also, are you keeping it simple OR exponential?
Regards,
Mahesh
A
1. Yes
2. Exponential because it is close to the current price
Hi Sir can u tell me best time for in month for call/put buy or sell
Buying at the settlement beginning, selling at the end
you r a blessing
Hello sir, Can i buy calls and buy puts with this strategy
The success rate will be 55%. However if you analyze OI + VWAP setup, then the success rate will increase to 75%
The success rate will be 55%. However if you analyze OI + VWAP setup, then the success rate will increase to 75%
How to set up this sir??
The best thing to double check what I say is to paper trade and try. Do it in a trading market. Come back with feedback and we can then discuss. Thanks.