The MACD can help you spot trends and momentum, so long you know how to use it right.
It can alert you about cash and FNO stocks with solid potential, much before others can latch on to these. But you got to understand its construct and play it right.
This article will help you do just that:
What are the key components of MACD?
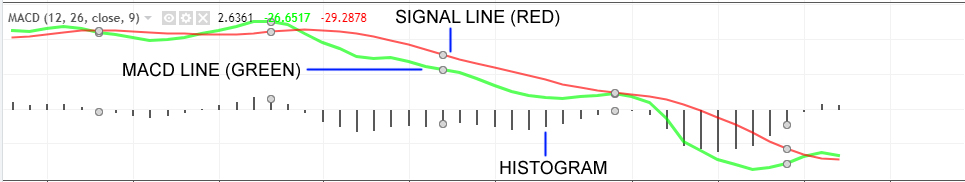
1. The MACD line:
This line is calculated as follows:
12 period EMA (minus) The 26 Period EMA
So the MACD line represents a difference between 2 EMAs – 12 and 26. This is the default setting.
It follows then if 12 period EMA is greater than 26 Period EMA, the MACD line will rise, and if it is lesser, than the MACD line will fall.
You need to understand this nature of the MACD line – it is very important.
2. The Signal line:
This is the 9 Period EMA of the MACD line.
As it is an average of an average, it is slower than the MACD line.
Therefore, if the MACD line rises, so will the signal line, and vice versa. The interpretation is same as the MACD line.
3. The Histogram:
This is calculated as follows:
MACD Line (minus) Signal Line.
The difference between the two lines is represented by a histogram.
When the histogram lines get longer, it means momentum and volatility has increased, and when they start getting shorter, it implies the momentum and volatility are decreasing.
4. The Zero Line
Zero line represents the zero value on the MACD chart, and it does have its own importance when it comes to interpreting the trading signals, as you will see below.
MACD Settings
The default MACD line settings are 12 EMA (minus) 26 EMA. The signal line is set at 9 EMA of the MACD line.
Leave these be. There is no point in finding the holy grail through trial and error. I have tried several setting and the default ones seem reliable….
BUT…
– add VWAP to charts that feature candles between 1 minute and 30 minutes to see through the MACD divergences and false positives.
AND…
add 20 EMA to charts that feature candles between 1 Hour and above to take care of MACD divergences and false positives
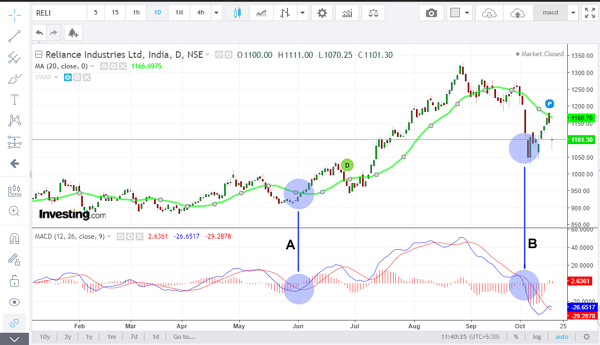
Let’s take an example:

Points A and B in the 15-Minute chart above signal a reversal of trend because the MACD line has fallen below the signal line. A run-of-the-mill analyst will term this as a divergence and confuse the hell out his learners.
However, note that the price does not fall below the VWAP, which is a signal that the 15-minute trend is still strong.
This is how adding VWAP to shorter period and the 20 EMA to longer periods can help you spot any false positives of the MACD.
The interpretation of the MACD follows below, and if you are a learner you should revisit this section after reading through the entire article and understanding how the MACD works.
Analyzing The MACD Signals
Think about this:
The MACD line is an EMA — and the signal line too is an EMA of the MACD line.
Both values are close to each other (MACD = 12EMA – 26 EMA) (Signal = 9 EMA of MACD)
THEREFORE…
It naturally follows both lines will move close to each other.
Now here are the signals you have to watch out for – note that this tutorial involves working MACD with VWAP/20EMA.
| SIGNAL | INTERPRETATION | WHAT TO LOOK FOR | ACTION |
|---|---|---|---|
| MACD LINE AND SIGNAL LINE RISING | Trend is Bullish (or turning bullish) | Price crossing above VWAP or EMA. | Buy if both signals are confirmed |
| MACD LINE AND SIGNAL LINE FALLING | Trend is Bearish (or turning bearish) | Price crossing bellow VWAP or EMA. | Short if both signals are confirmed |
| MACD LINE CROSSING ABOVE SIGNAL LINE | Trend is Bullish | Price crossing above VWAP or EMA. | Buy if both signals are confirmed |
| MACD LINE CROSSING BELOW SIGNAL LINE | Trend is Bearish | Price crossing bellow VWAP or EMA. | Short if both signals are confirmed |
| Histogram Lines Shortening | Volatility and momentum are reducing, and it is possible that the trend may change | 1. Any turn in the MACD lines 2. Price behaviour in relation to VWAP/EMA | Buy or sell per signal (you can interpret based on the combinations above) |
| Histogram Lines increasing in height | Volatility and momentum are increasing, and it is possible that the trend will strengthen | The distance between the price and the EMA/VWAP | Stock is worth a buy or a sell depending on the direction provided by the signal |
The Zero Line signals are discussed separately.
MACD – Dangers of the Zero Line Signals
Many MACD followers trade based on Zero line crossovers.
This can be a mistake.
Let’s understand this with an example:
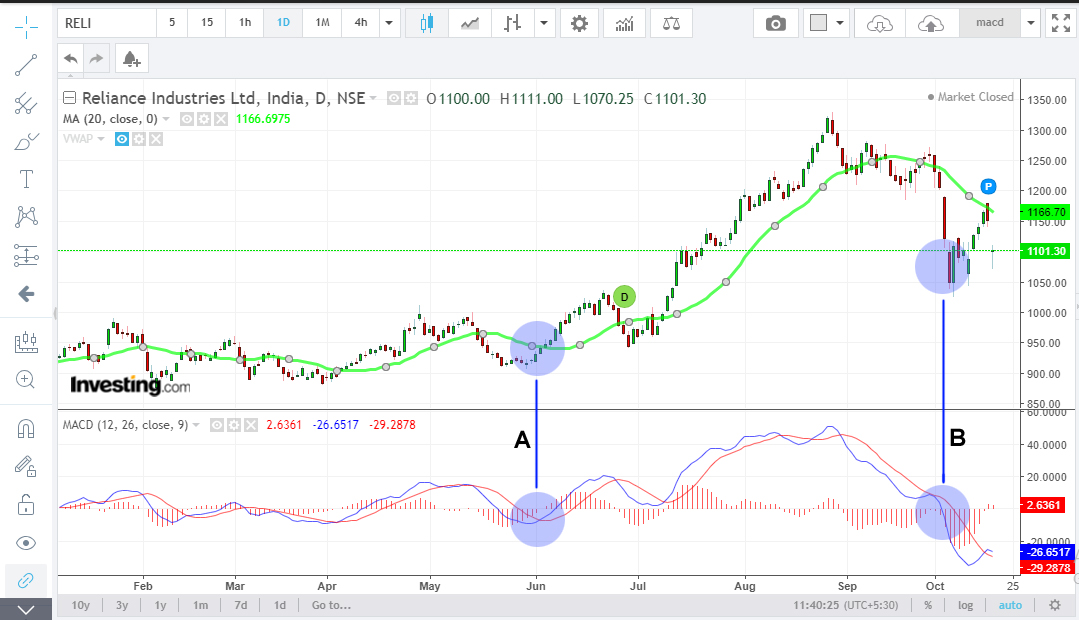
You can see that at point A, the MACD line crossed above the Zero Line and the signal worked as the price continued to rise. Even the EMA confirmed the entry.
Now check point A. At this point the MACD line crossed below the Zero Line and the signal flopped. In fact, if you had taken based on this signal, you would have lost money in quicktime.
What sets apart point A from point B?
It’s the distance.
If the MACD line is at a big distance from the Zero Line, then you should avoid Zero Line crossover signals, especially since you have so many other signals to follow.
Now, even though the Zero Line crossover worked when the MACD line was near to it, you will observe from the chart above that the signal was delayed.
Therefore, the Zero Line crossover signals:
(a) are either delayed
(b) or, are very delayed
This is the reason why you can avoid Zero Line signals, especially when you have gotten so many other things working for you.
MACD Screener Configurations
(For 1-Minute to 30 minute charts)
MACD Line Crossed Above Signal Line (or, MACD Line Crossed Below Signal Line [for shorts])
(15) Minute Close Crossed Above VWAP (or, (15) Minute Close Crossed Below VWAP [for shorts]) (adjust period per trading preferences)
(For 1-Hour to 1-Month charts)
MACD Line Crossed Above Signal Line (or, MACD Line Crossed Below Signal Line [for shorts])
(1-Hour) Close Crossed Above EMA 20 (or, (1-Hour) Close Crossed Below EMA 20 [for shorts]) (adjust period per trading preferences)
That’s all there is to it. Hope this post helps you understand MACD and apply it profitably.
Sir, one doubt here, you mean to say if MACD cross over below zero line we need to wait for It to cross EMA 20?
Nope, I mean ignore the zero line crossovers
Can you check the Dr. Reddy laboratory weekly chart it showing positive sign on MACD, RSI, tradig above MA 20, 50 and 100. But below 200 day.
Thanks for the article. I have read through the article. There are some corrections to be made. Should i point them out?
Please do. Also expect a reply.
This Worked perfectly in JSW Steel Today on a 15 min Chart.
Also worked perfectly on Wipro in Hourly chart.
The only problem is to identify when this happens and in which stocks. So for that i guess for that we will have to use a programmed system unless there is a better way out.
Bonjour, comment sortir de position ? Il est juste préciser comment entrer en position!
Exit depends on your trading strategy. If you use day candle, you can set a SL of 2% and then trail higher. For day trading a 1% loss is recommended because you’ll be trading momentum
Greetings,
Thanks. I have a doubt. You wrote
”
Therefore, the Zero Line crossover signals:
(a) are either delayed
(b) or, are very delayed
”
please explain what the ‘delay’ is
Before any crossover happens, the lines start rising. You need to watch the lines rising from under the zero line. By the time it crosses the zero line, you may have missed the action. That’s why I used the word, delay.