Last week, I had discussed about how MACD Bullish Crossover should be interpreted and used while picking stocks using Chartbot.
I suggest you read the MACD article before this post.
This week, let’s chat about how MACD Bullish Crossover and RSI Over 50 on the Chartbot can help you discover exciting stocks. But before that…
What is RSI (Relative Strength Index)?
RSI measures a stock’s momentum by measuring the speed and variation of the stock’s movements. A number is then allotted between 0 and 100. Typically, the interpretation is that when RSI crosses 70, the stock is overbought and when it falls below 30, it is oversold.
Chartists into day trading track RSI swings at all levels, because even a downturn or upturn at any value can signify a profitable opporunity.
How to Interpret RSI over 50?
Chartists interpret RSI at level 50 while analyzing candlesticks. We’ll go into candlesticks ina different post, but what is important to understand is that when RSI crosses 50, it is interpreted as “bulls are in control.”
Does This Combination Suggest a Short- or Long-Term Trade?
The MACD is typically a short term pointer. However, as discussed in the MACD Bullish Crossover, it is possible that it can help you discover a stock with long-term potential.
The RSI is a momentum oscillator that is usually set to a 14-day period. Short term traders set it to 7-9 days, while long term traders set it to 24-28 days.
Chartbot’s RSI period is set to 14 days and therefore you can interpret the combination to signify:
(1) A short term trade if the stock is traded in futures
(2) A long term trade for cash stocks with good fundamentals.
(3) Please avoid stocks with lousy fundamentals.
It is important that you study the fundamentals of every stock before making a decision.
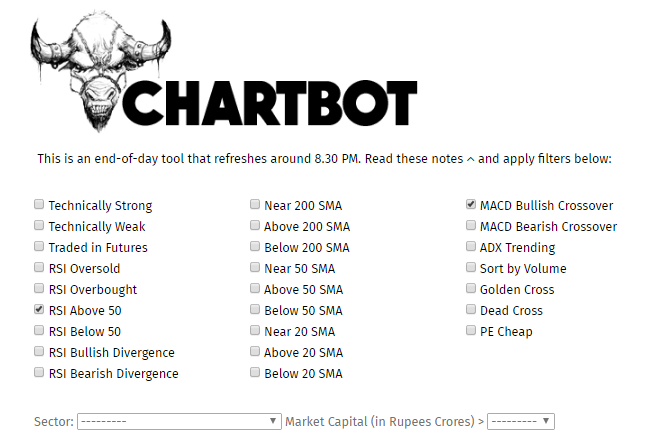
Chartbot Example of MACD Bullish Crossover + RSI Over 50
I chose both indicators on Chartbot (see Featured Image) and came across a list of stocks, and this time as an example, I picked a FNO stock, Ujjivan.
Here’s what its charts told me:

The RSI at 55.70 suggested that bulls had recently taken control and the MACD at 1.26 (Signal line 0.837) also suggested that super strength because the crossover had happened below the zero line (read the MACD article for the interpretation).
This made me conclude that Ujjivan was a stock worth tracking on Tuesday, the 26 December 2017 (next trading day)
So this is how yo should interpret the MACD Bullish Crossover and the RSI Over 50 indicators together. Happy stock picking!
Sir, it well explained requesting you please write in brief one by one filters so that new comer like me can have use…
God bless you..!!
What should be chart setting (15m,30m,1h,1D,1w,1M) for day trading, swing trade and long term trade, while using RSI and MACD
bullish crossover.
Thanks
15m-30m for intraday
1h for BTST
1D for minimum 2 days + short term
1W for short-medium
1M for medium-long term
What is chartbot?…..Can you send the link of the chartbot.
I had it on the site but the service provider closed shop…