
Futures prices of stocks and indices are usually higher than the spot prices because the positions can be carried forward till expiry by paying the required margin.
Therefore, it can be deduced that:
- When futures prices fall below or start falling below the spot prices then it implies someone is selling heavily in the futures market and that the spot prices may follow soon.
- When futures prices rise above or start rising the spot prices it implies someone is buying heavily in the futures market and that the spot prices may follow soon.
Right, now let’s set up the trade.
You will need:
1. VWAP
2. 10 EMA
3. Volumes
4. 15 Minute Candles
5. Futures prices and Spot prices on the chart.
How to Set up Futures and Spot Prices on the Same Chart on Investing.com
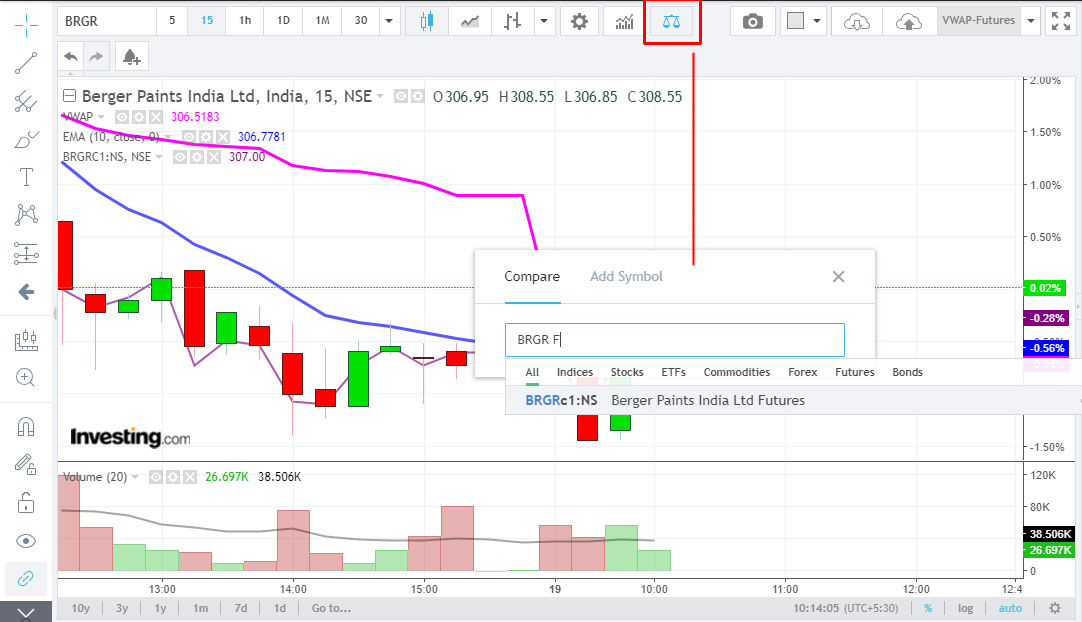
Set up the stock and indicators at Investing.com and then click on the “Scales” icon (highlighted in the image above).
A popup will open and enter the stock name or symbol followed by the word “Future.” The Futures name will show up automatically (so long it is a FNO stock).
Add the stock (the price will show up as a line).
Rules and Interpretation of The Futures-Spot Strategy
1. To profit from this strategy, you must watch the charts tick by tick.
2. This is more of a tick-by-tick price actions strategy.
3. The Futures and the Spot prices act as magnets to each other. When the futures starts moving above the spot prices and goes higher, the spot prices will get pulled by it. If the spot prices don’t get pulled, then the futures price will fall to the spot price, and so on.
4. This is why volumes are very important and these too must be watched tick by tick. If the rise and fall in spot prices is backed by good volumes, it implies the trend that will last for a few candles.
5. The 10 EMA should be used as a trend indicator. If the price remains above it, the trend is bullish for the day, and vice versa.
6. The VWAP can be used as a SL (but it cannot be used in all cases. In cases it cannot be used, use your discretion to log out of trades).
Example:
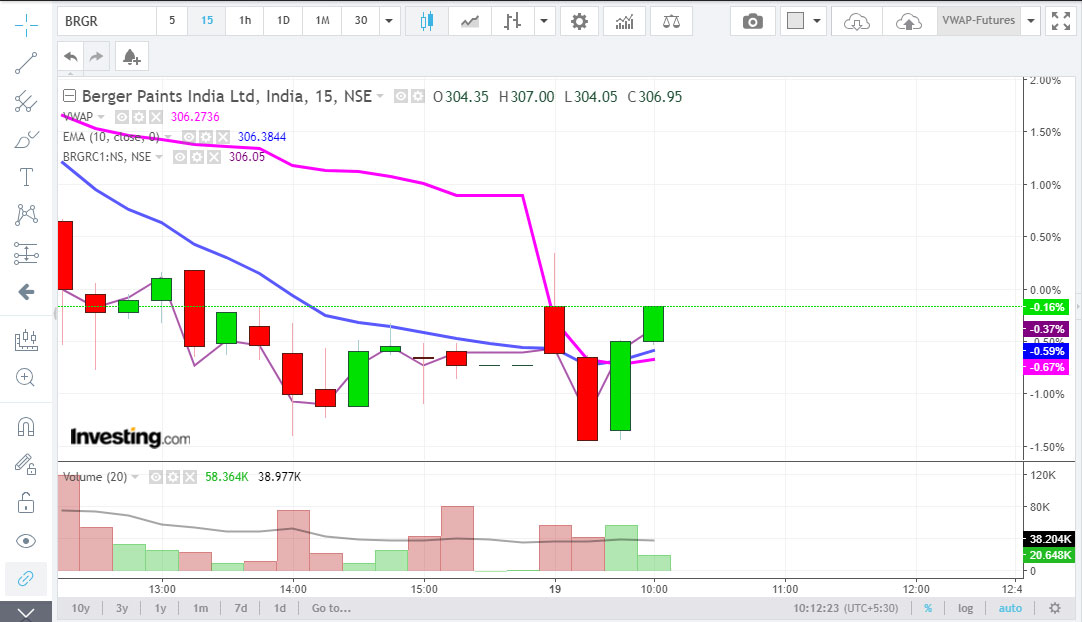
Here is today’s (19-7-18) example of Berger Paints. I was watching it tick by tick (so that I could write this article) and here’s what I observed.
1. The stock fell from 305.25 to about 304 at the first and after 50% of the second 15M candle was formed.
2. Half way into the second candle the futures price started rising and crossed over the spot price. The stock reclaimed lost ground and was back to its opening levels of 305.25.
3. The futures price moving higher than the spot price was a buying signal at 305.50.
4. By the next candle the stock hit 308. A clean 0.8% gain if the signal was acted on. The volumes too were higher than the volumes 20 DMA (the black line that you see across the volume bars)
5. Later, this happened:

6. The Futures price started moving above the spot prices and the stock hit 310. But it could not hold on because the volumes were poor. So, the weight of the spot price pulled the futures price down.
7. But by this a scalper would have already profited (from 3o5 to 310) and may have moved to another trade.
Conclusion
Go ahead and paper trade this strategy and check if it works for you. Do not enter real trades until you have fully understood and practiced the strategy.
To identify stocks with potential, it will do you a world of good if you can interpret OI data. Read up the linked article to understand how OI works and how to use it to mine stocks with potential.
Sir, very difficult to identify spot price in the chart. And the price you mentioned is hard to identify per candles. Can there me more simplest ways to understand?
Focus on the futures price line in the LIVE market, tick by tick. When it starts rising or falling, it implies something is up in the futures market. Then correlated it with the spot candles. You seem to have viewed the chart post-market. You should watch it in a live market.
will surely focus on live market. Thank you sir..
Hi Sir,
This strategy is used to buy/sell shares on spot prices or future prices. As per my understanding, this is to buy shares on spot prices based on future prices. I am little bit confused. Please confirm.
It is explained in the article