
Wouldn’t it be great if you could figure out stocks before these start buzzing?
Of course, you would. And this post should help.
Let’s start:
There are three steps to discovering stocks that are about to begin their upward (or downward) journey:
1. Setting up Screener
2. Checking Daily, Weekly and Monthly Charts
3. Reading the AR/Fundamentals
One Rule You Must Follow
Technicals can be used to create alerts, but you MUST NOT buy a small or midcap stock just because the technicals suggest so – the fundamentals MUST justify the price movement.
Right, let’s move on:
STEP 1: Setting Up A Screener to Detect Buzzing Small and MidCap Stocks
Typically, small and midcaps are cornered before the price starts acting up.
Therefore, the first step is to set up a screener that can discover rising volumes and/or rising prices.
I set up a screener that checks both, and here’s the formula:
Latest Close Crossed above Latest VWAP
Latest Volume Crossed above NUMBER 50000
The price moving above the VWAP on the daily chart is an extremely powerful signal that suggests buyers are chasing the stock.
The volume number (50,000) in the case above is a variable. You can even substitute it with 2,000 if you’re an illiquid stock hunter.
You also can remove the 20EMA crossover that is suggested. It all depends on you.
Once the results are in, you must eliminate the penny stocks (1 buck, 2 buck stocks) because you don’t want to go there.
So, let’s see what we got:

From what we see above, let’s scrap out Goenka Diamonds and move on to Vijay Shanthi and figure out what’s happening with it.
STEP 2: Checking a Small Cap on the Daily-Weekly-Monthly Charts
We need the On Balance Volume (OBV) indicator now to figure out how the volumes are moving.
The OBV adds volumes to the previous day’s OBV if the stock has ended with a gain, and subtracts from the previous day’s OBV if the stock closes negative.
So if it rises, it means traders are interested in buying the stock and if it falls it implies traders are getting rid of it.
Let’s see what the Vijay Shanti charts say:

There’s a bullish engulfing formed on 9-11-18 with rising OBV. A bullish sign.

I’ve drawn a trendline on the weekly charts and even that suggests a breakout. The OBV is flat though, indicating there was no one in hot pursuit of the stock during the week. Let’s see what the monthly charts say.
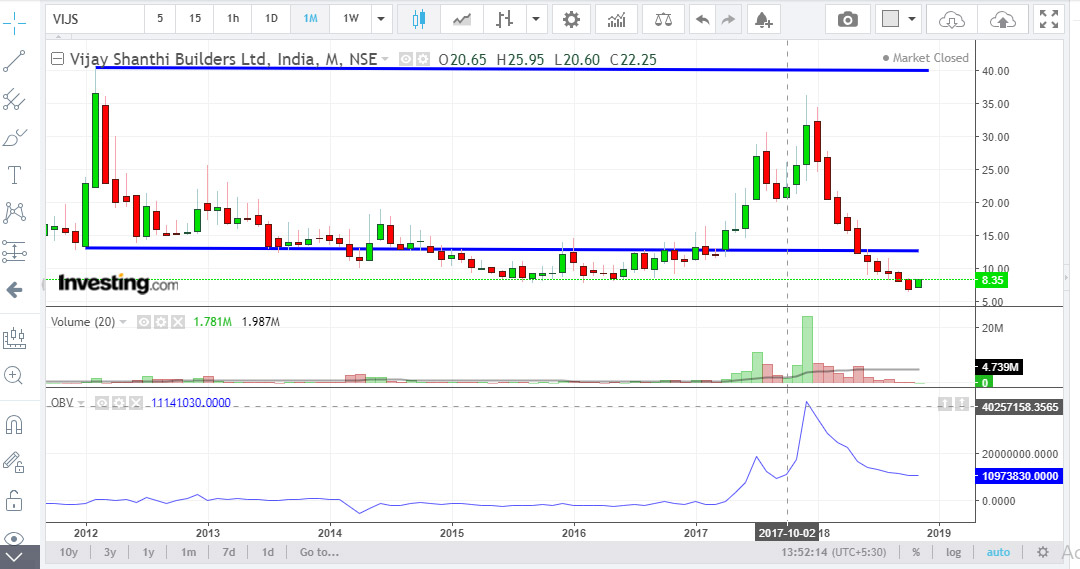
The monthly charts suggest the scrip is below its support levels. There was a massive drop in the OBV in January 2018, maybe because the company delivered disappointing results.
The monthly charts also suggest that the support is at around 13 and the stock can spike if it crosses this level.
Broad analysis: The monthly and weekly charts are subdued, but the daily chart suggests that the stock can spring back to life. Either some investors have gotten interested or there’s some development in the company and the insiders have started buying. Therefore this stock’s fundamentals should be checked.
STEP 3: Fundamental Analysis
Okay, these two posts will help you analyze an Annual Report:
Post 1: How To Analyze an AR
Post 2: How To Check the Quality of a Company
A quick glance tells me that this Chennai-based company’s fortunes had dipped (maybe because of demonetization, RERA and GST) in the preceding quarter, but it is possible there may be some pick up (based on technical data).
That said, you should not do anything until you analyze the fundamentals, and perhaps chat with the CS.
What you have read above is one of the techniques I use to figure out stocks before any buzz hits them. Use it and tweet if you come up with a great stock.
which screener you used? kindly provide the link
Chartink
PI industries
Rajesh Exports
Indostar capital Finance
Sakuma Exports
Dalmia Bharat Sugar
gallantt metal
Hi sir,
Why don’t you have a Search box on your site ?. It is helpful in looking up posts with a specific content.
Not yet