
NOTE THIS FIRST
Your brokerage would typically be Rs 20 to Rs 50 per lot PLUS Taxes.
Trading one lot cost you up to Rs 500 in brokerage (100) and taxes (400).
To break even, you’d need a movement of 7 points minimum.
If you sell before that, you lose.
If you make a loss, you lose capital + brokerage + taxes.
Rules of Trading 15 Minute Charts
- This strategy works best for Indices and FNO stocks.
- This is an Intra Day Strategy. However, you can apply it to longer period charts if you are a swing or medium term trader.
- This strategy will not work on cash stocks.
- You have to be extremely agile and always watch the charts while holding a position.
TRADING THE 15-MINUTE CHARTS
You will have to setup:
- VWAP (learn it here) (Primary indicator)
- EMA Cross (5 period/12 period – disregard this config) REVISED ON 27-6-18 TO (5 period/8 period)
- Directional Movement Index (Primary and very IMPORTANT Indicator) – SET IT TO 9 PERIODS
- RSI (14) (Secondary or Confirmatory Indicator) – SET IT TO 9 PERIODS
- Volumes (Secondary or Confirmatory Indicator)
HOW DOES DIRECTIONAL MOVEMENT INDEX (DMI) WORK?
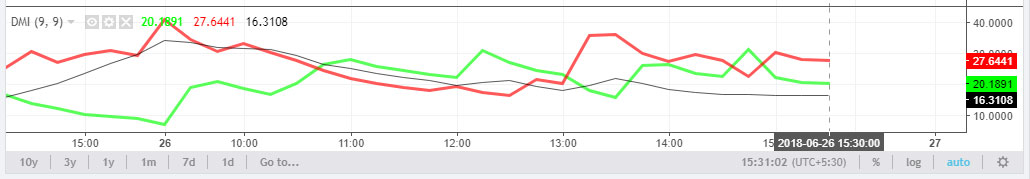
Don’t be intimidated by the indicator looks on the charts. It is extremely simple to understand.
It is an extremely important indicator because it calculates the strength of the stock by correlating the highs and lows.
The Directional Movement Index has three components, and each is explained below. To understand this indicator, you must know the implication of its calculation.
POSITIVE DIRECTION (DI+) (The Green Line):
If Today’s High is greater than the Prior High, then the DI+ gets a positive value.
If Today’s High is lower than the Prior High, then the DI+ gets a zero value.
Therefore, if the DI+ line is rising, it implies that the stock price is witnessing solid buying and HIGHS are getting higher. This is a BULLISH signal.
NEGATIVE DIRECTION (DI-) (The Red Line):
If [Prior Low (minus) Current Low] is greater than [Today’s High (minus) Prior High], then the DI- gets a positive value.
If not, then the DI- gets a zero value.
Therefore, if the DI- line is rising, it implies that the stock price is witnessing selling pressure and the LOWS are getting lower. This is a BEARISH signal.
AVERAGE DIRECTIONAL INDEX (ADX) (The Black Line):
The ADX Line does not signal price direction. Rather, it indicates the strength of the trend.
Below 25 – The trend is weak – perhaps the stock is oversold
Between 26-50 – Trend is fairly strong
Between 50-75 – Trend is super strong. Options Writers love this range.
Above 75 – The stock may be overbought. Options Writers more-than-love this range.
TRADING THE 15 MINUTE CHARTS
I’m assuming you know how to interpret the RSI. If you don’t, read this first.
Okay, let’s interpret our setup now for 26-6-18 (the whole trading day):
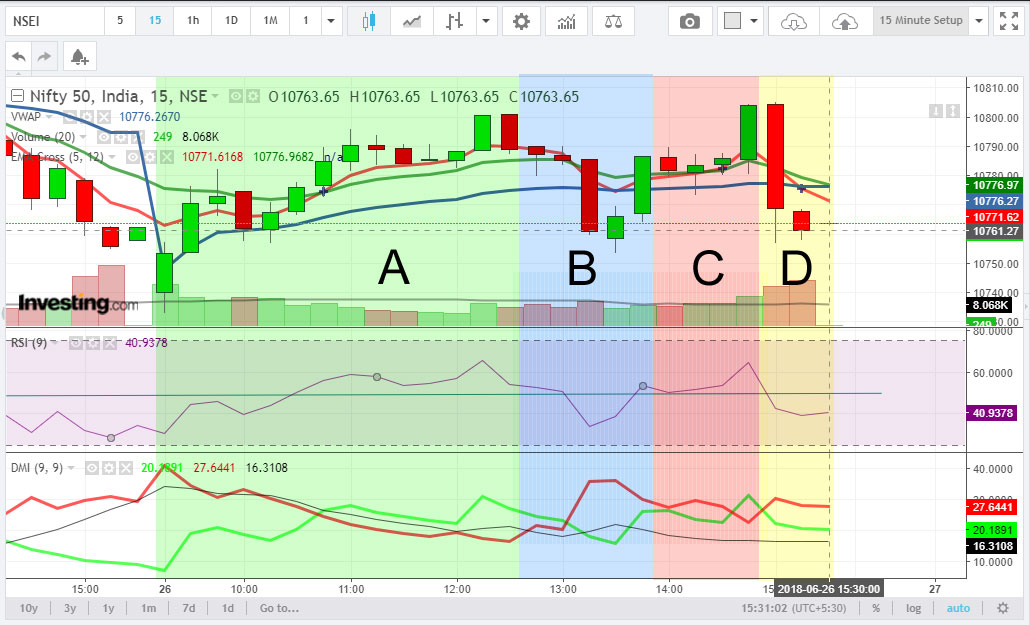
PHASE A: FROM 9.15 AM TO 12.30 PM (Highlighted in Green)
Right from the word go, between 9.15 and 9.30 AM
1. The price moved above the VWAP.
2. The RSI started marching towards the 50 mark.
3. The DI+ line started moving up (indicating higher highs) and the DI- line started falling (indicating higher lows).
Though the EMA Crossover did not happen at this point, three indicators pointed to a bullish trend. The ADX line did not suggest a strong trend as it remained below 25, but that didn’t matter because 2 components of the DMI were +ve.
At this time the Nifty was around 10750 and it became a buy.
AT 12.30 PM (Highlighted in Green)
The RSI started falling. The DI+ line too started falling and the DI- line started rising.
Both bearish signals.
Though this was not confirmed by EMA Cross and VWAP, it always was and is a good idea to take profits.
At this time the Nifty was 10790.
A clean 40 points gain.
PHASE B: FROM 12.30 PM TO 1.30 PM (Highlighted in Blue)
The RSI fall accelerated. The DI+ line fall and the DI- line rise too started accelerating.
Both bearish signals.
Though this was not confirmed by EMA Cross and VWAP, it was clear that the 5 Period EMA was getting close to the 12 Period EMA and the price was being pulled by the VWAP below.
At this time the Nifty was 10785.
At 1.15 PM it hit 10760 and started rising.
A clean 25 points gain.
PHASE C: FROM 1.30 PM TO 2.45 PM (Highlighted in Pink)
The RSI started rising along with the DI+ line. The DI- line started falling. The price also crossed over the VWAP.
Three bullish signals.
It was entry time. At this time the Nifty was about 10778 and it climbed all the way to 10803.
A gain of 25 points.
PHASE D: FROM 2.45 PM TO 3.30 PM (Highlighted in Yellow)
If you have followed the observations above, you can easily interpret that all indicators turned negative.
Even if you caught the red candle half way at 10785, you’d have made 25 points because it slid all the way to 10760 before recovering.
So, well, you now have this trade system for intraday trading on 15 minute candles and if it interests you you should paper trade until you are comfortable.
Finally, the DMI is a super indicator – add it to all your setups.
Thank you
Chartink doesn’t offer dmi …is there any other indicator we can use for intraday ?
fine guidance sir.
Sir can you please share the set up for short-term trading like for few days to few weeks thank you
Sir from where do you get such charts and softwares which provide you such readings and Indicators and signals?
I’m Sahil Dialani from Nasik and am 20years old and currently pursuing CA. This has become my passion in less than two years and I’m eager to learn and as earn as well. Kindly guide me please.
Investing.com
sir appreciate if you could make a youtube video
it would be great if you start your youtube channel and make videos to let people understand these indicators as many guys wont understand just by reading this and youtube even offers you bigger audience for you and BULLBULL.
Yes I will. Thanks for the suggestion
Hi sir, first of all thanks for all your efforts.. I have been following your site from quite sometime, I would like to know, from this kind of setup, which options strikes to we need to pick up for successful trades ? Could you please make an article on that also ? It would be really helpful for novice traders like me. We know we have gained 100+ points in the above setup but i am not sure which option strikes to pick to be successful. thanks for your help again.
For options use DMI and VWAP.
If price rises above VWAP and DI+ starts rising, buy ATM CE.
If price falls below VWAP and DI- starts rising, sell OTM CE near expiry.
and so on
Sir,
If we apply this to 5min or 10min chart, what will be the implications?
I understand we will have to enter and exit faster. But anything else you see as another problem?
Regards,
Mahesh
No problem as such. Please take into account brokerage and taxes. The smaller time frame movements can be subject to a lot of whipsaws.
Sir, this is one of the best setup for intra day trader I ever witnessed in my trading career uptill now but the real problem is the selection of stocks. Can you throw some light on his to filter the stocks for day play. Thanks.
Set up EOD screener for Futures stocks that have crossed above 50DMA and check on charts. Don’t use this setup for cash stocks.
Thank you for your blog, it is very helpful.
Hopefully this strategy will work for commodity market too.
If you have anything especially for commodity, I request you to advise on the same.
Regards,
Pushkar
Sir great work … Sir for options which charts we have look after and what is the time frame for that ?
What I gather from reading..Vwap may be used at the very first to enter the trade along with other indicator like rsi, dmi n adx. But later the trade is more comfortable using dmi and rsi.
VWAP can be used as an exit trigger too
sir what time frame of candles is good for few weeks, or a month sort of time frame. or rather will the technique work for those ime frames. if looking for 20 30 % move . even in these do we need to discard long candles . can the tgt be decided in this technique
This strategy is specifically for intra day trading, or BTST max
Hi,
Is the setup above for trading in futures or intraday equity trades or both?
thanks.
All cash rates
Sir ,
Very well Explained , Combination of 3 indicators works , there is less chance of False
Signal. Please guide us more strategy like this .
Nainesh
http://www.micro-solution.net
Sunilji,
Pls ref to your figure. Can a short selling be made between say 12.45 and 1.30 PM ?
( price above VWAP, but candle is red. DI- is raising, RSI falling)
This is also helpful content.
https://myfinanceadvices.com/how-to-predict-nifty-movement-for-intraday/
All the points are described crystal clearly. You can also find this idea and the movement for bank nifty and nifty. This is very helpful content I have found.
https://myfinanceadvices.com/how-to-predict-nifty-movement-for-intraday/