The Bollinger Bands indicator is made up of 3 bands:
Upper Band
Middle Band
Bottom Band
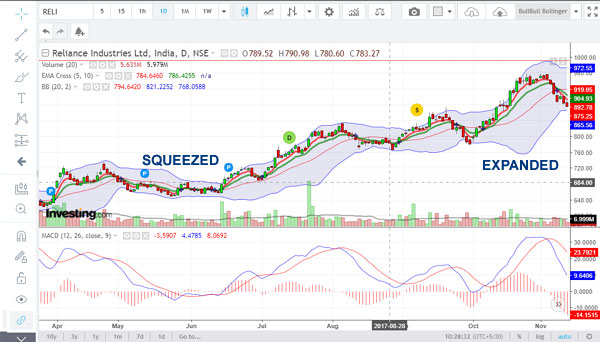
The top and middle bands are low and high price boundaries, and these moving higher or lower based on price movements. Let’s explain this with a chart:

Check how the band positions shifted. When Reliance was in the 600s, the bands were at a lower position on the charts and look at how they shifted position when Reliance moved higher.
The Upper Band is the 20 Period SMA + a Standard Deviation Formula
The Middle Band is the 20-Period SMA.
The Lower Band is the 20 Period SMA (minus) the same Standard Deviation Formula
Don’t worry too much about mastering the formula – leave it for the mathematicians.
All you need to know that is that the upper and lower bands keep pace with the price.
The Upper Band denotes the high price and the bottom band denotes the low price.
The middle band is the 20 Period SMA.
Prices move in the band.
One mistake traders make is that they sell when the price hits or crosses the upper band, or buy when it slips or hits the lower band.
This is a wrong strategy and it is the reason why I explained right at the beginning that the bands will move in sync with the price.
Let’s now understand how to trade using Bollinger Bands
Ideal Indicator Combination:
You can add the following to Bollinger Bands (Leave default setting as is)
MACD (Default settings)
EMA Crossover (Intra Day traders can use the 5-and-10-Period or 5-and-8-Period Crossover, while Swing Traders can use the 9-and-15-Period Crossover. Medium and long termers can extend EMA periods per their style (13,48 – 20,50, etc.). Note that the EMA Crossover indicator is optional.
BOLLINGER BANDS TRADING STRATEGIES
A. TRADING THE SQUEEZE
When the Bollinger Bands are squeezed, it denotes a steady trend AND when the bands continue to remain squeezed, it implies that an extreme bout of buying or selling can occur at any time.
Check the Bajaj Finance Chart and view the period of squeeze and expansion. You will witness that expansion (volatility) occurred after a period of steadiness (squeeze).
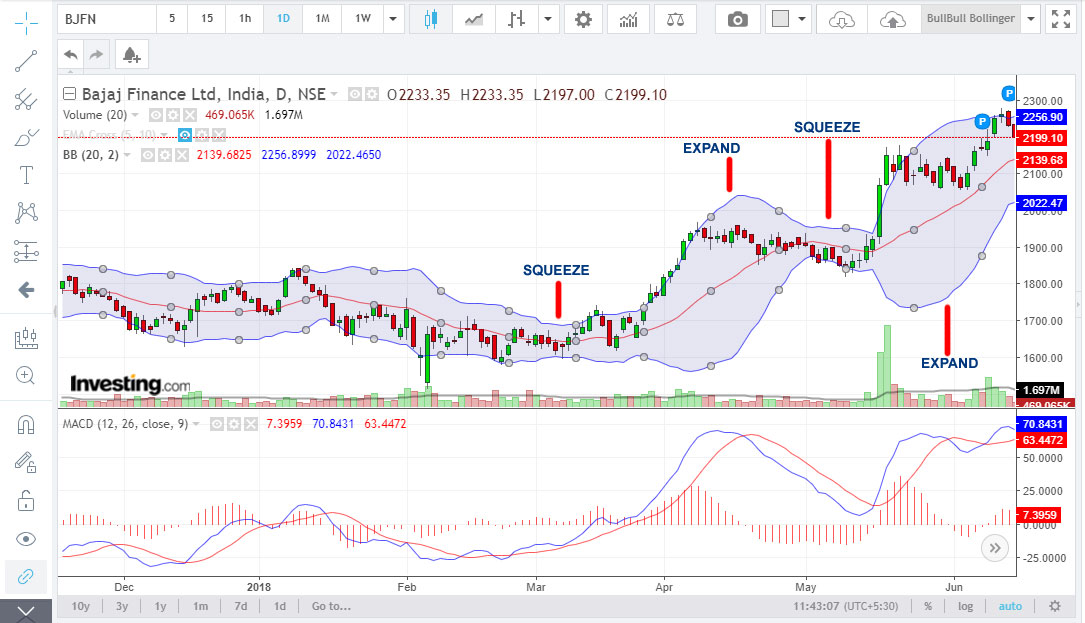
Therefore, when you see that the Bollinger Bands are squeezed, look for the following signals:
- Price rising with rising volume (Bullish) OR price falling with rising volume (Bearish). Check the Bajaj Finance Chart’s squeeze periods. In the first squeeze, there were 4-5 days of continuous buying followed by 2 days of selling. In this period the price remained above the middle Bollinger band on all days except one.In the 2nd Squeeze period, there were 4-5 days of continuous buying and then the bands expanded.At both times, the MACD too signaled a buy, so that was good confirmation. If you are unaware of how MACD works, please read this guide.
- If, when in a squeeze, prices move to wards the upper band it makes for a bullish signal and when they move towards the lower band, it makes for a bearish signal.
B. THE TRADITIONAL BOLLINGER BANDS TRADING SIGNAL
By definition, Bollinger Bands imply that the the price will hit either the top or the bottom and settle down around the middle band. So, the trader must enter when the price starts moving above (bullish) or below (bearish) the middle band.
Let us see if this traditional trading method works out:
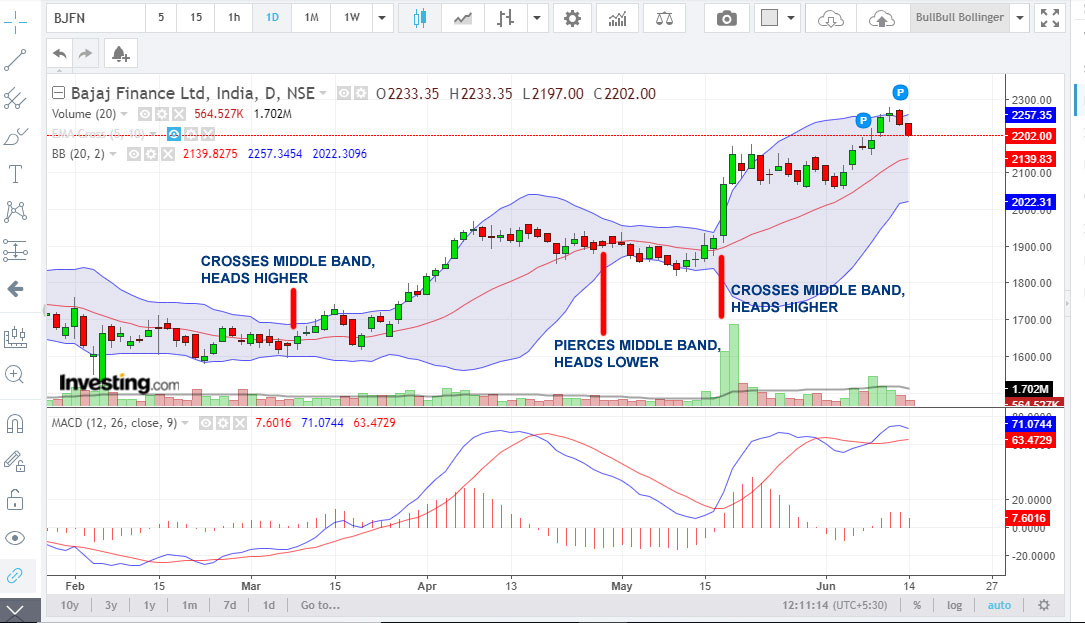
As you can see from the Bajaj Finance chart above, the traditional method of trading Bollinger Bands does work out.
However, it will help if you use another indicator such as the MACD. If you notice, the MACD gave an advance signal in the chart above.
You can play this strategy like this:
1. Buy when price crosses Middle Band so long it is validated by MACD or volumes. – If the band is squeezed, you can consider holding for a longer period.
2. Sell when price hits Upper Band when the band is expanded and so long it is validated by price action (candles, volumes).
3. Sell when price pierces below the Middle Band if it is validated by MACD or volumes. If this happens when the band is squeezed, you can hold the short for a longer period or consider buying PEs.
4. Buy when price hits Lower Band when the band is expanded if validated by price action (candles, volumes).
5. Undecided players can play the swing between the Middle Bands and the Upper/Lower Bands so long it is validated by MACD.
C. INVESTORS AND THE BOLLINGER BANDS
Sometimes, it can pay very big time when long term investors watch the MONTHLY or WEEKLY charts using Bollinger Bands.
If you have understood what was explained above, check the following chart.
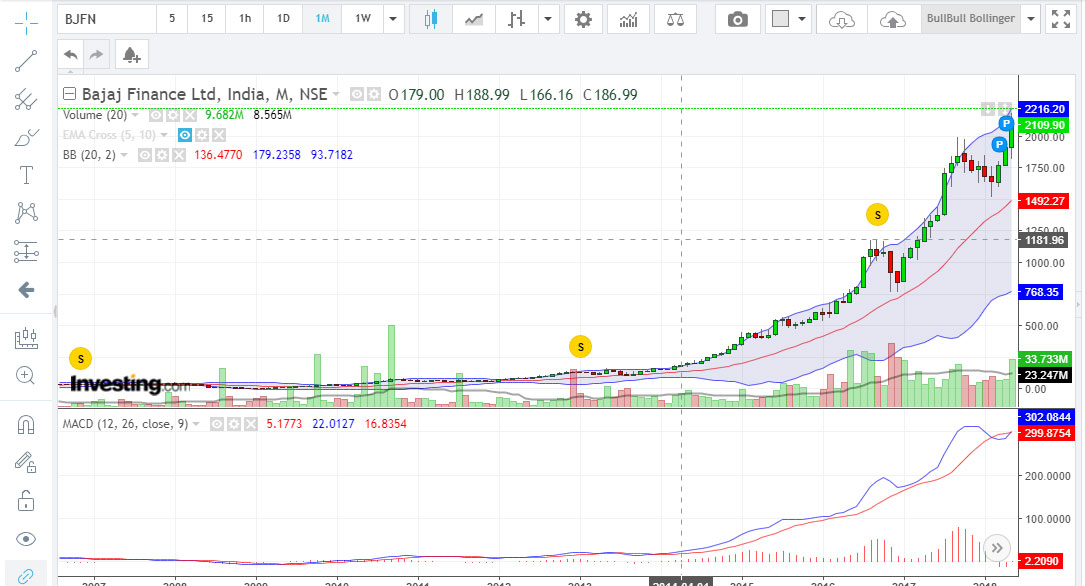
Without looking at any other indicator, I can say with confidence that Bajaj Finance is headed much higher in the long term, but it is possible that the Bands will narrow and the stock will enter into a steady phase before the next move.
D. BOLLINGER BANDS AND TIME PERIODS
Bollinger Bands works well on all time periods. However, you should always check the 1H, 1D, and 1W charts to understand the big picture before taking a position.
Conclusion
Now remember that no technical indicator is perfect and the same goes for Bollinger Bands.
That is why it is always a good idea to validate its signals wih another indicator, such as the MACD,
This post would have given you a fair idea on how to trade Bollinger Bands, Go ahead and perform some paper trades to check its efficiency.
Excellent idea about behaviour of Bollinger bands along with MACD
Great explanation of BBands ..
Beautifully simplified the oscillator, thanks
Dear sir really nice and useful article for beginner like me (simple and effective )
Thanks
Good learning
Excellent post. Thanks.
Good Article sir.Keep ding good work.
excellent article, keep going sir
Hello sir … sir I’m using 15SMP INDICATOR so I’ll apply BB BAND 15,2 is this right ???? thank you very much sir
Keep Bollinger at 20,2
if using bollinger band middle band will be used as SL and upper/lower band as targets?