It is now well known that:
1. The market opens at 9.15 AM and takes about 45 minutes to stabilize and show its true colors (say at about 10 AM).
2. Serious players get in after 2 PM and set the trend for the coming days.
This strategy will help you figure out:
1. Which way the market will trend in the first half
2. How the market will possibly behave between 2 PM and the close (3.30 PM).
To play this strategy all you have to do is:
1. Watch the charts continuously
2. Know how to draw a straight line on the carts
5 Minute Candle Price Action Strategy at 10 AM
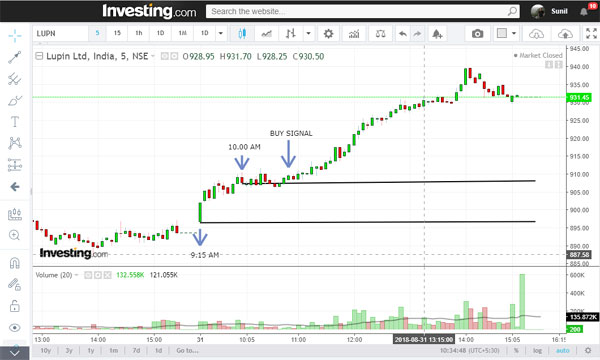
Mark the highs and lows between 9.15 AM and 10 AM by drawing straight lines.
Let’s take an example:

Lupin’s started the day at around 896 and ht about 908 by 10 AM.
This range was marked on the chart above.
The higher price becomes the resistance and the lower price is the support.
At around 10.15 AM or so, the price broke convincingly above the higher range at 910.
This was a buy signal. The price went on to hit 940.
Let’s take another example – of Indraprastha Gas:

In Indraprastha Gas, using the same technique as above, we get 292 as the resistance and 289 as the support.
The price broke below 289 at 10.05 AM and fell to 185.80, from where it started rising.
Had you shorted at 10.05 AM, you could have made 1+% gains.
Rules of this Strategy
1. Buy when the price breaks above the resistance
2. Sell when the price breaks below the support
3. Expect gains up to 2%
4. Set stop losses at about 0.75%
5. Pay attention to the length and number of candles crossing above or below the ranges – the longer, the better.
EXERCISE:
5 Minute Candle Price Action Strategy at 2 PM
2 PM is when it is said that the serious players get in.
And now, this is the part where you learn to rely on your own.
Draw ranges as per the previous strategy between 1.30 PM and 2 PM on any FNO stock and observe the price action after 2 PM.
Remember that the serious players get in after 2 PM and therefore you can get many BTST (or even longer) signals by marking ranges at 2 PM.
This exercise will help you draw basic chart patterns and eventually become a better chart reader.
Sir, Instead of Coal India,it should be Indraprastha in above example may be typo? always very well explained . Thank you.
Thanks, corrected
I don’t think that the typo is corrected Sir. Still showing ‘Coal India’ instead of ‘Indraprastha Gas’.
2-3 candles may take it to 2 percent target or nearby.
How to identify stocks for 2nd half of the day or btst
excellent strategy .i wiil try
Interesting post Sunil ji. However, you seem to have marked low/high of 9:15-9:20 candle and 9:55-10:00 candles and not the high/low for the period.
The above post mentions: “Mark the highs and lows between 9.15 AM and 10 AM by drawing straight lines”
So, what would be the right approach – What you have done vs the text of the above post ?
Thank you for your kind help and clarification
Thanks Sourabh. Please mark the highs and the lows. I’ll post another graphic later because in any case, the fluctuations weren’t much on each 5m candle.
He has probably drawn the line on the Close it to include as many candles as possible.
Expect gains up to 2%
Set stop losses at about 0.75%
% of What?
Obviously the CMP
entry price
Hi Sunil,
For the above strategy how do you suggest that I select stocks for the same. I cannot possibly open up the charts for 100-120 FNO stocks to look for morning and afternoon range breakouts.
thanks,
Aravind
Use a screener
What should be the ideal criteria to scan for in Chartink?
Your tweet “2 engulfing scanners” would give us the list?
There are many scanner combinations. I have made just 2
How to select stocks for this strategy?can pick any fno stock for the day which break the trend or any analysis needed to pick the stocks?
Please browse through my blog and read up posts. You will find a few posts that will help you select stocks.
Hi SUNIL
As per this strategy we need to mark high/ low for considering all candles between 9.15 and 10 am or high / low for only two candles – one at 9.15 am and second at 10 am. Because in case of IgL there are two more lows than ur marked one @10 am.
OK, mark the highest and the lowest in the 45 minute period.
But you can be flexible depending on the kind of candles and volumes you encounter.
I face problem with exiting a trade. Even here if we keep on waiting, reversal takes place and we lose the profits. How do we trail the stops? keep trailing SL to previous candle high/low ? What is the preferred method?
Work with 2% Gains and 0.75% SL
Should the full body of the candle be formed above the support/resistance for me to enter?
Yes, since it is a 5 minute candle, it will not make you wait long
Sunilji, can you suggest a good screener? Thanks
Chartink
I tried this strategy today in axis bank. Sold at 666(500 shares – equity) and position closed at 660(buyed). Booked profit RS. 3,000 in intraday.
Thank you sir,
Happy to know
Do we need to take high and low of the 9:15 to 10 or high and low of first and last candle
High and low between 9.15 and 10. If market is volatile take HL between 9.15 and 9.45
5. Pay attention to the length and number of candles crossing above or below the ranges – the longer, the better.
Sir,
Length of candles signify increase in price. In some cases I have noticed that the candles are extremely long between 9:15 to 10:00. Should we still enter after cross above resistance as it has already gone up enough (2% up)?
what does number of candles signify? Some stocks take many candles before It crosses above/below resistance/support.
Yeah, if you see continuous greens or reds, and big ones too, then you can
It’s simply great strategy …well experienced teacher Sunil sir.thanks to you
Sir, if we are using dual super trend to filter whipsaws, what would be the 2 parameters that would work for shorter time frame 5 – 15 min. Thanks in advance
Good Afternoon Sunil Sir,
Any single place where we can access all the Price Action Guide parts i.e. from 1 – 11 that you have published.
Pls share location.