This strategy actually goes against what the herd is doing.
Any amateur trader knows that a bunch of inexperienced traders jump into stocks at the opening based on news, open =high (or low), TV expert comments, etc.
Amateur traders also know, or should know that the biggies and the professional traders enter the market after 1.30 PM and then dictate the trend from thereon.
This trading will help you hunt the hares (the herd) with the hounds (the biggies).
15 Minute Price Action Trading Strategy
What you need:
15 Minute charts
VWAP
This strategy should only be used on FNO stocks and indices.
How To Play This Strategy at 9.30 AM
As stated earlier, the assumption is that many amateur and new traders enter right at the opening and either buy or sell the stock for whatever reason.
As time goes by, they square up their positions and some make profits and some lose out.
By the time they get out, a trend gets established.
This is how you play this strategy in the opening:
1. Mark the high and low on the first 15 minute candle body (you can include or exclude the wicks – try both and check anyway). The top line is resistance and the bottom line is the support.
2. Start watching the stock from 9.30 AM on.
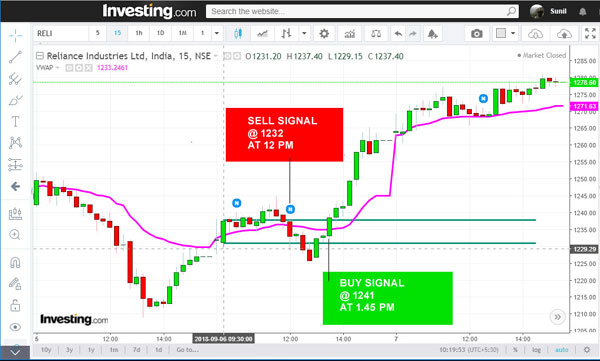
3. If the price crosses above the resistance line and the VWAP, it becomes a buy.
If the price crosses below the support line and the VWAP, it becomes a sell.
Let’s take an example:
How To Play This Strategy between 3.00 PM and 3.30 PM
The market typically buzzes around with pros between 2 PM till close.
Between 3 PM and 3.30 PM, the amateurs and the revenge traders likely square up their trades.
At this time you should decide whether your position is good enough for BTST, or whether you should square it up intra-day.
This is how you play this strategy between 3 Pm and 3.30 PM (assuming you have not booked profits earlier):
1. Mark the high and low from between 1 Pm and 3 PM if you have decided to go BTST.
2. If the price remains above the VWAP and close to the resistance line, you can carry it forward.
If the price starts dropping towards the VWAP or crosses below the support line, book profits.
(Play the reverse in case you have shorted.)
Let’s take an example:
Very nice.
I have tried this but aroun the 4th candle my S.L was triggerd not one time three time
Please mention stock and date so that your claims can be verified. I have backtested this strategy n 30 stocks before writing.
Need your help , how to back test any intraday strategy?
Try Zerodha Streak
Late reply, however would this work on option trades as well? More specifically on daily SPY trading?
For option trades, it is better to double check FNO data
Sir, doubt on 9:30 AM strategy – if we have bought at 68, our stop loss should be low of first 15 min candle body? Or, we should wait and exit if a 15 min candle closes below VWAP?
SL points
VWAP
10 EMA
S/R Lines
Could you explain this please
It is self-explanatory
Sir, I guess you’ve marked open and close of 15 min candle in above charts. Please correct me if i am wrong.
Yes. You also can try marking H and L, and check which works best
Sir, Do you use chartInk to get alerts? Can you please suggest which site/application you use for scanner and alert for intraday trading.
Thanks.
scanners – Chartlink
alerts – moneycontrol, investing
Which candle stick to use? Normal or heiken aishi? Because
Normal. The Heiken Ashi is like a glorified average of the current and past candles OHLC and it can give a false signal, esp in shares that are turning around.
Hello sir,
Good articles really. One question, may sound silly, do we need to use fibonacci pivot points (continuous or normal) for resistance and support levels?
No necessary. Reconcile EMAs and targets with your gains and SLs.
Simplify your trading life. Don’t overthink.
Beautiful….thank you sir
Sir ….i am a starter in trading …..
Guide me frm where i should start learning….
Wait till 1 October. Keep watching my Twitter announcements.
i have found very simple trading tools with thisartcle
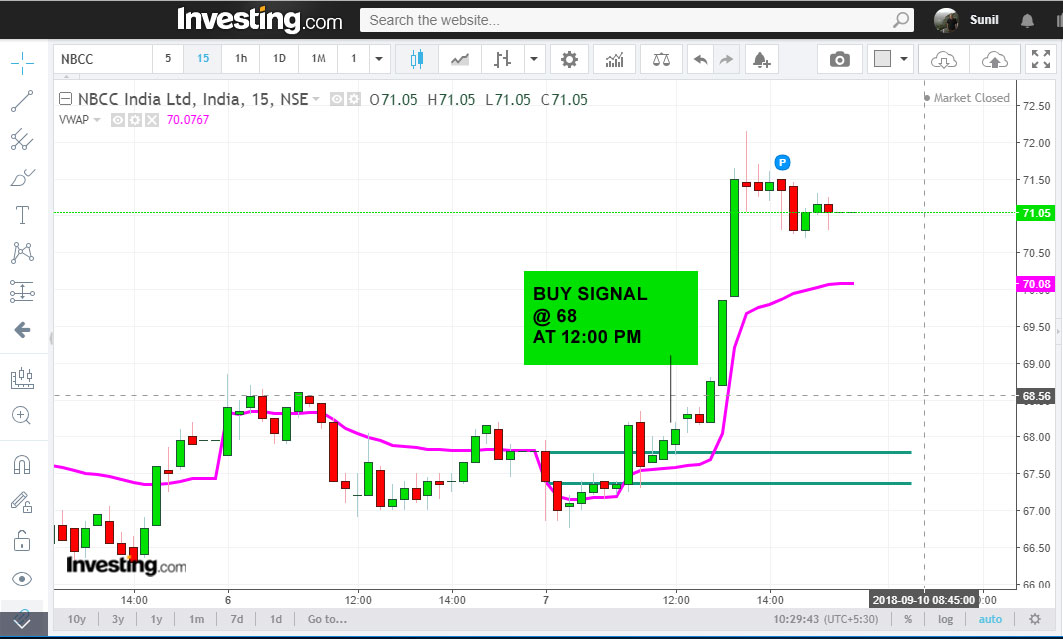
Sir, isn’t the big green candle at 11:15 a buy entry, that also VWAP and broke the resistance? Why did u chose to enter at 12:00?
This is doing good Sir…..
Thank You
ld singh .it was successfull on friday day trading
Hi!
How do we mention the current price in Streak algo? I was trying to emulate “3. If the price crosses above the resistance line and the VWAP, it becomes a buy.” from your steps in Streak, but, could not find any suitable usage/indicator for mention current price.
~Newbie
I urge you not to play with static technical formulas in Streak. You’ll end up paying brokerage for trades triggered the time your price is above VWAP after meeting your 1st exit conditions.
Thanks for replying! Since you had mentioned Streak, I too was trying to backtest. It will be great if you could give a snapshot of what you had entered in Streak. I just want Streak to give alerts, because I cannot monitor prices all the time.
~Newbie
sir
today 03.10.2018 i sold 2 lots in M&MFIN @ 404.15 between 11.00-11.15 AM candle when previous candle closed below VWAP and Lower than 9.15-9.30 Candle Lower level.
i placed an order to buy at 398.15 with the stop loss at 407.55
but unfortunately it bounced back and hit my SL at VWAP line at 407.55 immediately in the next candle 11.30 AM :((
kindly advise, do we need to filter more or it was just a matter of chance :((
i am writing this message at 2.30 PM after waiting for movement since 11.30 am till 2.30 pm
I’ve replied to your question on Twitter.
can I apply this strtegy for cash trading ?
If you mean for cash stocks, then NO
how can i got your prev (1-9) old posted article on Price action.
Thank you Sir. Worked well on Escorts today 05.10.2018 at 1.45 PM. 🙂
Happy to know
Thanks for sharing strategy. Since I trade in Banknifty,the first 15 minute candle is very long and sometimes really long with long wick and sometimes with long body too. how can i trade in such setup
Include wicks while creating the S/R lines if body is short
how to find stocks for this strategy?
Sir thanks for sharing this strategy. I wanted to know about the BTST accept of the trade where in we assume that resistance being the low of the 3 pm and support being the high of the 1 pm candle. Is this understanding correct here ?
For BTST, you need volume analysis. Ill blog that tomorrow
Sir Did you write anything on volume analysis. If yes, could you please provide me with the key word from that blog I will search the link. Thanks
how to find stocks for this strategy?
.where can we get the trade set up
Based on the 1:00 pm to 3:00 pm S/R Line I am trying to do a Chartink screener.
This should provide me with a list of stocks which fall in the BTST category.
Below is the screener which I should run at 3.01 pm.
Latest Close Greater than[-8] 15 minute Open
Latest Close Greater than[-8] 15 minute Close
Latest Close Greater than[-1] 15 minute Open
Latest Close Greater than[-1] 15 minute Close
Latest Close Greater than Latest VWAP
This should give me bullish list of stocks. Is this correct?
Is there anything else I need to consider?
8 candles implies you want to set a range for last 120 minutes.
60 minutes will do.
Also make one for bearish trades.
Please do post links when done. Thanks.
Thank you for the feedback.
I have amended the screener from 120 to 60 minutes. Below are the links for Bearish & Bullish screeners.
Bullish : https://chartink.com/screener/btst-bullish-4
Bearish : https://chartink.com/screener/btst-bearish-1
Sir, I want to create a screener for the morning strategy, what more I need to add to the above screener?
One of them could be volume
Volume analysis works better while analyzing trades after 2 PM
ok. so for the morning one do I need to consider anything else. because you generally provide a list before trading hours or the previous day. You mentioned about writing on volume analysis. Has that been published sir
Not yet. Crunched for time
[…] Use this 15 minute candle strategy. But don’t use it for BTST, square up positions intra day. […]
Sir RBL Bank Ltd. it has fallen on 19.10.18. From the OPTION CHAIN, if you were me which CE or PE or Both will you buy on 22.10.18. so that I can clearly understand the theory with this as an example. If you do not mind sir.
Markets are too fluid to predict beyond 24 hours. I would watch the price action in the morning and decide which CE or PE to buy. The CE or PE must be within the daily volatility range, once the price action strategy confirms a trend.
[…] The setup used in this example is our 15 Minute Price Action strategy. […]
is it possible that on any day this set up doesnt actuate?..i tried paper testing on BNF on 06.11.2018..couldnt find any trade..
There was a clear sell at 1.30PM. You have not understood the article. I suggest you sharpen your understanding of price action before applying strategies.
no call generating on BNF on 05.11.2018 too
The VWAP did at 3 Pm and the price action confirmed at 3.15 PM. You should re-read the article and understand it before applying
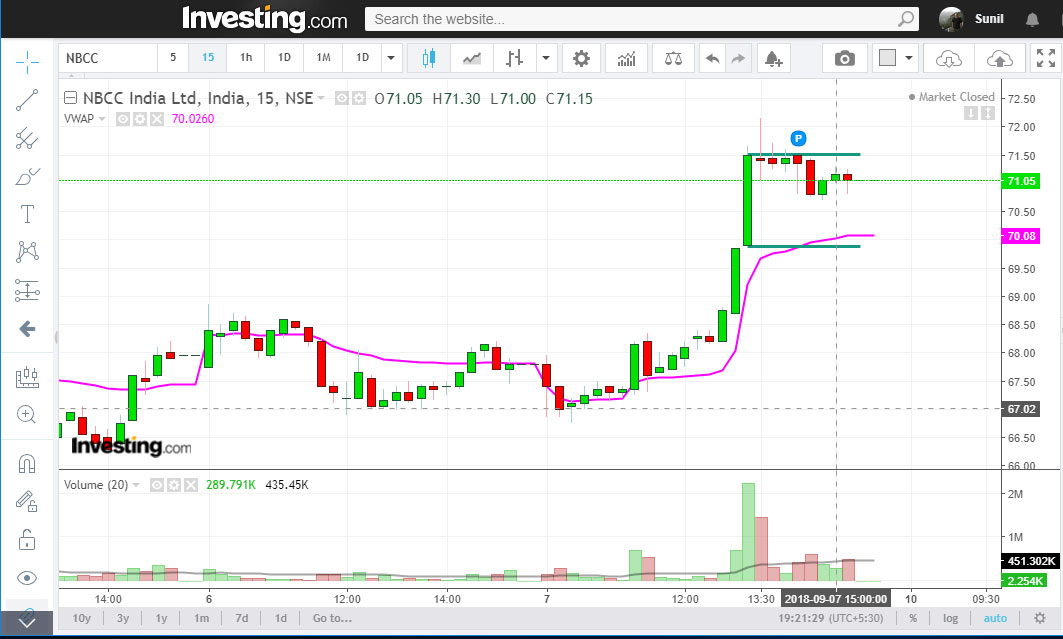
hello sir, out of 200 fno stocks, how i choose those stocks upon which this strategy can be applied. why reliance or nbcc; why not u picked DLF. thanks
Sir,
I have tested this after market hours and posted Chartink charts on twitter . Hope you read them. The strategy is simple but effective. Hats off Sir. I will try live action tomorrow with your suggestions
Sunil sir it worked for me today in arvind as opening 15 minor candle I marked and it crosses baap and resistance I bought future fo 8 points gain booked nicely presented.
Thanks
Hi sir.
I have been following you since a while now and I have been back testing the 15 min candle strategy for a while now and it has been wrong superb on around 10-15 stocks..yesterday ncc was gem it gave around 6rs fro the signal generated..thank you sir..waiting for telegram channel of yours sir.god bless you.
A stupid question but will ask it What is VWAP
Volume Weighted Average Price
Hi Sir,
This strategy is bit confusing me on the 1/1/2019 Niftyjan11000CE end time between 1 to 3 PM , but next day 2/1/2019 as per the explanation the price should go up but it has fallen like anything for the NEXT day start itself, can you please help me on this it will be helpfull.
You cannot be using previous day’s 5 minute candles to determine next day’s strategy. If you don’t have this basic knowledge, I suggest you don’t trade
Hi Sir,
I am asking about BTST strategybetween 1 to 3pm, can you explain in brief if possible
Markets are very choppy these days and therefore do not use the setup to carry forward trades
Ok sir thank you so much for your valuable time and suggestion,
Can you please suggest me which is the best strategy to move with.
Excellent Article. Practical knowlege, You are the best sir.
Salute.
you have any jobs on offer, would like to join you and work closely with you.
Have work experience of 10 years with American company.
trade is my passion.
Thanks. Will let you know.
Hi Sunil, is there a VWAP value I should be using? I’m using EDELWEISS trader and when I use this indicator there is an option to enter the value and default is 10.
I’m guessing 10 is the period (10 minutes). If so, use 15-minutes for a clear signal
Appreciate quick response, thank you so much.
One more query do we need to wait for the confirmation candle? If we take today’s instance 27th April, Nifty April Future the 15 Minute candle formed at 9:30 crossed both resistance and VWAP so should we execute the trade and the candle completion? or as soon as it crossed? I follow you on youtube as well may be you can post a quick short video on this would be great. many thanks in advance.
Check my video series on price action.. you will understand everything better