This is a step by step guide. Let’s get started:
GENERAL RULES
- Traders MUST read this article before jumping into a trade. Know that once you know the big picture and the short term trend, you can use 15m and 30m candles to enter into a trade.
- The VWAP generally equalizes with the CMP during the day, and that is the time a trader should act. If the price starts moving above the VWAP, it is bullish, and the VWAP will gradually move up to equalize with the price over the space of a few candles.
- Investors should work with 1-hour or 1-Day charts. 1-Day charts can provide better medium term cues, while 1-hour charts provide the trend for a swing trade.
- Use charts only for FNO stocks and Indices. Do not track illiquid stocks on charts because these can be manipulated easily.
- This trade setup will give you about 2-3 trades on the Indices every week, and no more. For stocks, it is up to you as it depends on the number of stocks you are interested in.
UNDERSTANDING CHART TIME FRAMES
A trader or investor typically checks 3 time frames:
- ONE WEEK for understanding overall trend (time period to check – 4-5 months)
- ONE DAY for understanding short term trends (time period to check – 5-6 weeks)
- ONE HOUR for entering into trades (time period to check – 3-4 weeks)
SETTING UP THE TRADE (Updated on 31-5-18)
- Log in at Investing.com
- Search for any symbol or index.
- Set up the following indicators:
a. SuperTrend (7, 3): It alerts you when the trend changes by plotting arrows on the chart.
b. VWAP (Volume Weighted Average Price): Bullish when price moves above it, and bearish otherwise.
c. Ichimoku Cloud: Read this post to figure out how it works.
d. MACD: Earlier, I worked with the Chaikin Oscillator but have found that the MACD gives a more reliable signal. Read this article to learn how the MACD should be interpreted.
e. I have added 13-DAY and 48-DAY EMAs to the setup. When 13D EMA crosses the 48D EMA it is a bullish signal, and vice versa.
f. Note that the images below do not contain MACD and the EMAs, but even without those, the setup works perfectly.
INTERPRETATION
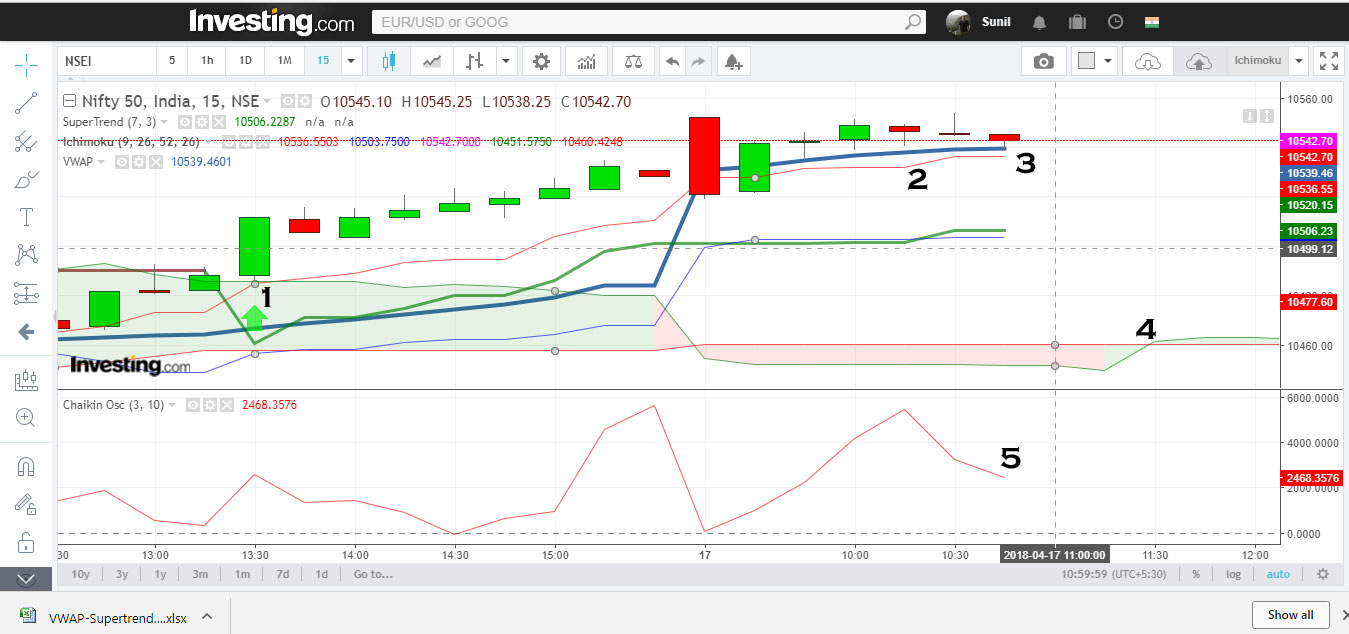
Check the numbers on the chart before reading this interpretation:
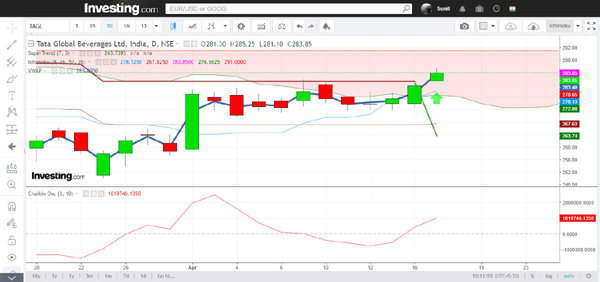
- Supertrend signaled a buy on 16-4-18 at 10488-10500 levels. At this point, the priced moved ferociously above the VWAP, another bullish signal. As you can observe, the VWAP (the thick blue line) moved up and equalized with the price after a few candles. Also, at this time the Ichimoku conversion line was above the base line, and the price moved above the conversion line, and so, we had a bullish trend confirmed by 3 signals, while the Chaikin Oscilltor suggested that money was moving out. However, the Chaikin Oscillator keeps evening out over a period of time, and as I recall, it was trending up when the other 3 signals suggested bullishness.
- The Nifty hit a high of 10,552 and started dropping (see the big red candle).
- Though the Supertrend indicator was still positive, the price started putting pressure on the VWAP and on the Ichimoku Conversion line (the thin red line) and that suggested that it was time to book profits and stay on the sidelines. The Chaikin Oscillator also indicated that money was dumping the Nifty (#5).
- The support for the Nifty existed at 10506 (the green Supertrend line) and 10460 (the first Ichimoku cloud line).
- This is explained in #3 above.
INTERPRETATION REVIEW
It is 11.45 AM now, and I am reviewing the interpretation written at 11 AM. Here is the chart:
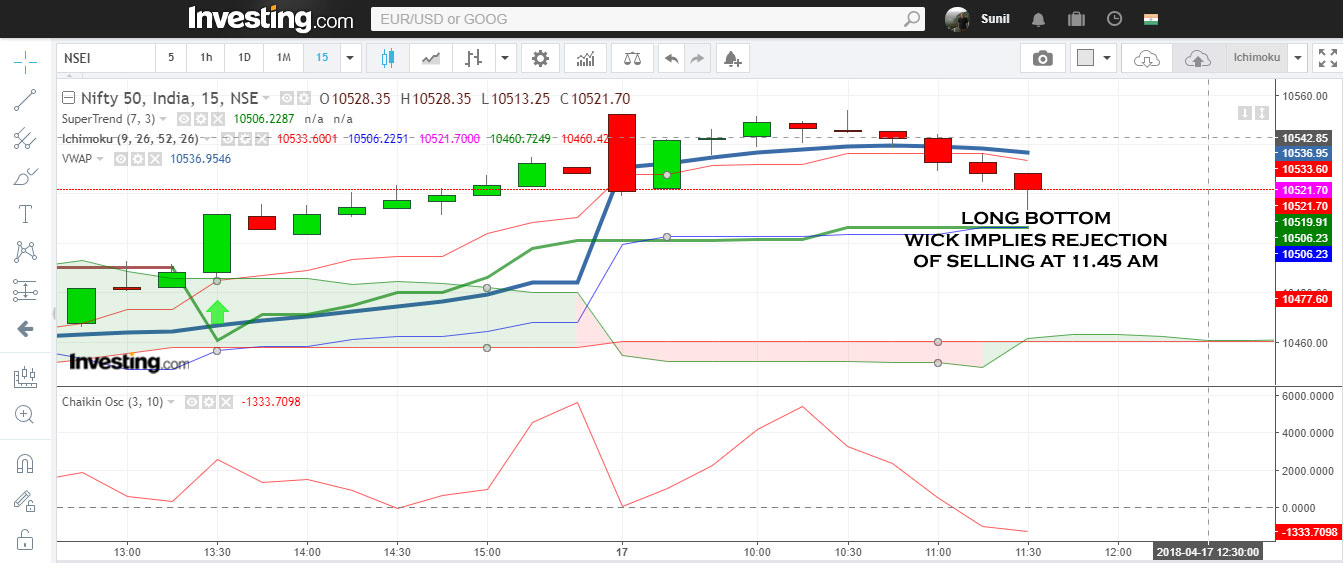
- At 11.45 the scenario has played out as per the interpretation above. At this time, the Supertrend is still bullish. On the bearish side, the Chaikin Oscilltor has seen substantial volume selling, the prices are below the VWAP and the Ichimoku Conversion Line.
- The Chaikin Oscillator also has flattened out and the last candle shows a rejection of selling. It’s 11.53 now and I see that the next candle is green, and the Chaikin Oscilltor has started rising. So at this point, I would wait to see how the price moves in relation to the VWAP and then make a decision. So, the strategy now is to sit on the sidelines and wait for a signal.
- Know that the 1-day Nifty Candle chart is in bullish zone and therefore any shorts should not me taken home UNLESS the 1D Chart reverses.
UPDATE ON 26 MAY 2018 AND 31 MAY 2018
You can try out the following three indicators as well. After writing this article, I have tested these and can vouch for their effectiveness:
- Supertrend (details above) (use it for entry)
- Ichimoku (use it for exits when it breaks Lead and Conversion Lines.
- MACD Here is a MACD indicator guide.
- VWAP (explained above) – to learn how stock will trend.
- EMAs as explained above.
That’s it guys. Put this to use for both trading and investing, as suggested above. Good luck.
Thanks a lot for sharing your knowledge.
Awesome Sunil Jee.
Thanks for your effort and time.
Sir supertrend and vwap indicators not available in investing.com
Available. I use these daily and I have a free account at Investing.com. Unsure why these are not showing for you.
Sir vwap n supertrend not available in investing.com..searched every where but couldn’t find it
can’t understand why. It’s showing for me and I’m a free member like you.
Sir where can i find the description/explanation for supertrend you had explained here. I am not able to find it.
Thank you sir for the amazing post..
I have just one question – How should we set targets in this strategy?
If you’re making 5% to 7% in quick time, make and exit. Don’t stay long with these stocks. These are swing trades.
Thank a lot Sunil Ji, I have one question – How to find this trade set up in shares. Any screener or should check one by one.
Sir, what is the use of lagging span? Thanks a lot
Dear sir , I have been reading your post since few days .all are amazing .every day learning new things .i have doubts about iantraday .i was backtesting intra day with Bollinger band , macd and slow stochastic..so far I am able to see results .as the daily candle touches the lower bollinger band …next day u get green candle .during this green candle day if the macd histogram is below zero the histogram bar generated by green candle is smaller than previous one . The slow stochastic gives buy signal . Have noticed with these three the next day produces green candle . I want to know is there any whiplash in this system . When do I make entry . Do I need anything else to be added with these ..
Thank you sir .
What period did you use? If it was 15-30 mins, then what did the hourly, daily and weekly charts say? Your question can be made complete by including these factors.
Oh ! Dint check those charts ..will now on check them too .. but my question was mainly about indicators .macd , bollinger and slow stochastic is this combination good enough . I have never tried ichimoku on short term charts .i find them better for little longer trades say 15 / 30 days holding period . Will try them also …thank you .
Always check the hour, day and week charts to know the big picture. If you short based on intraday technicals, the trend can quickly reverse because the stock may be in a bullish phase in the short-medium term. Re stochastics and Bollinger – Bollinger can be used like Ichimoku except that Ichimoku gives you the trend for the next 26 days.
thank you so much sir ….
Sir,
I depend on my cellphone for stock related operations. Zerodha Kite has Chaikin money flow and Chaikin Volatality which to choose. Your articles are quite educative. So usefulm it helps put in place what I learn from other sources like books & Net
Regards
Ultimate knwoledge Sharing by U sir … I have been Foolwing u and ur articles from many days ..
I have just started practicing above method and today i successfully executed one trade and earned some money.. Thank you so much sir for such a wonderful method..
It is not in my capacity to review your hard work.The process you defined here is blend of multiple techniques and I hope it is very much useful for traders specially for newbies.
Sir, for Intraday 15 min or 30 min chart to use to enter in trade?
Best to use 1 hour
Sir In this trade set up we have check manually each and every stock or any AFL available (amibroker)
Thanks
You can view 8 stocks in one window and set alerts for each. That’s the max it can do.
Sir Thanks for your quick reply
This statargy will use commodity
thanks sir pls sir statargy for money flow chart