Support and resistance levels are trigger points on a chart that alert a trader/investor about the stock’s price moment in the near future.
Typically, a support point represents a price at which buyers will or should buy the stock and the resistance point is when sellers will dump the stock.
The idea being that if a trader or investor knows the support and resistance levels, he can enter into profitable trades or book his profits or SLs.
There are two general rules of Support and Resistance:
FOR BUYERS: A stock falling to an old low is worse than a stock falling down to its old high.
FOR SELLERS: A stock piercing above its old prior high is better than when it pierces above its old low.
Though you cannot time the market, learning how to tell the support and resistance levels can help you get the timing almost-right.
Here’s how you discover support and resistance levels.
A. Horizontal Support and Resistance lines
Horizontal lines are the gold standard in discovering support and resistance levels.
In fact, the most successful traders use horizontal lines, and so should you.
Take a chart that contains at least 100-200 candles – it can be of any period. Actually the period depends on what type of a trader you are (day, swing, short, medium, etc.). There is a reference at the bottom of this article that will help you choose a period depending on your trading style.
Now, with the chart open and the period chosen, look for:
(1) At least 2 points where the price tried to break out above but did not succeed
(2) At least 2 points where the price tried to break down below but did not succeed
Let us take Marico’s example:
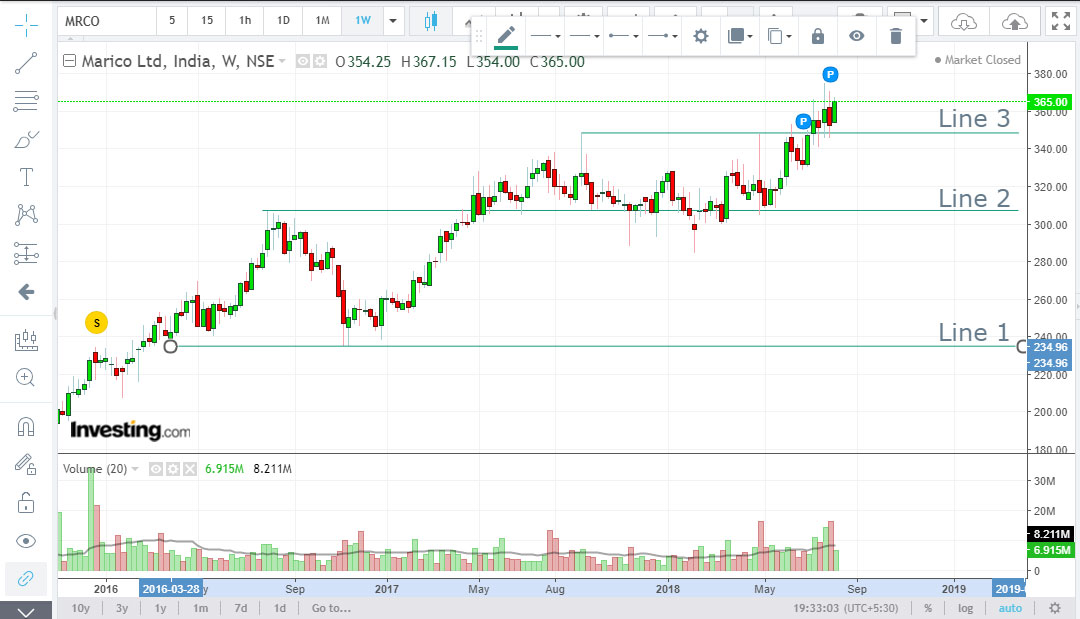
I have used weekly charts as I am a swing trader. Let us suppose that I would like to swing trade now (as on 13-8-18).
Between March 2016 and December 2016, it saw fell twice to 234, but the price held at this level and bounced back.
So, let’s draw a line and say that 234 or so represents a long term support. Refer Line 1 in the figure above.
Between August 2016 and April 2017, it tried to break above 309, but it encountered selling pressure and fell.
So let’s draw a line here. refer Line 2 in the figure above and say that 309 was a resistance.
In early May 2017, the price convincingly broke out above 309.
This suggests that 309 was the new support (resistance become support).
Then, between September 2017 and April 2018, the stock tried to break out of 347 levels.
Let’s draw a line here that enjoins at least 2 attempts to break out of this price. Refer Line 3 in the image above.
In July 2018, the stock successfully crossed above 347.
Therefore, 347 now becomes the new support (for a swing trader).
Here’s what should be done if you want to trade Marico:
- Watch OI data. If bullish, enter. If bearish, avoid. If neutral, enter if the Nifty trend is positive, else avoid. The linked article will help you analyze OI data.
- Apply the MACD indicator and hold until the MACD line pierces below the Signal line. Here is a post on how to work the MACD.
This is how you should use horizontal lines to determine support and resistance levels.
B. Marking Highs and Lows
(the following sections were written earlier – so you will encounter old charts. In any case, the recentness of the charts doesn’t matter because this post is all about understanding the concept)
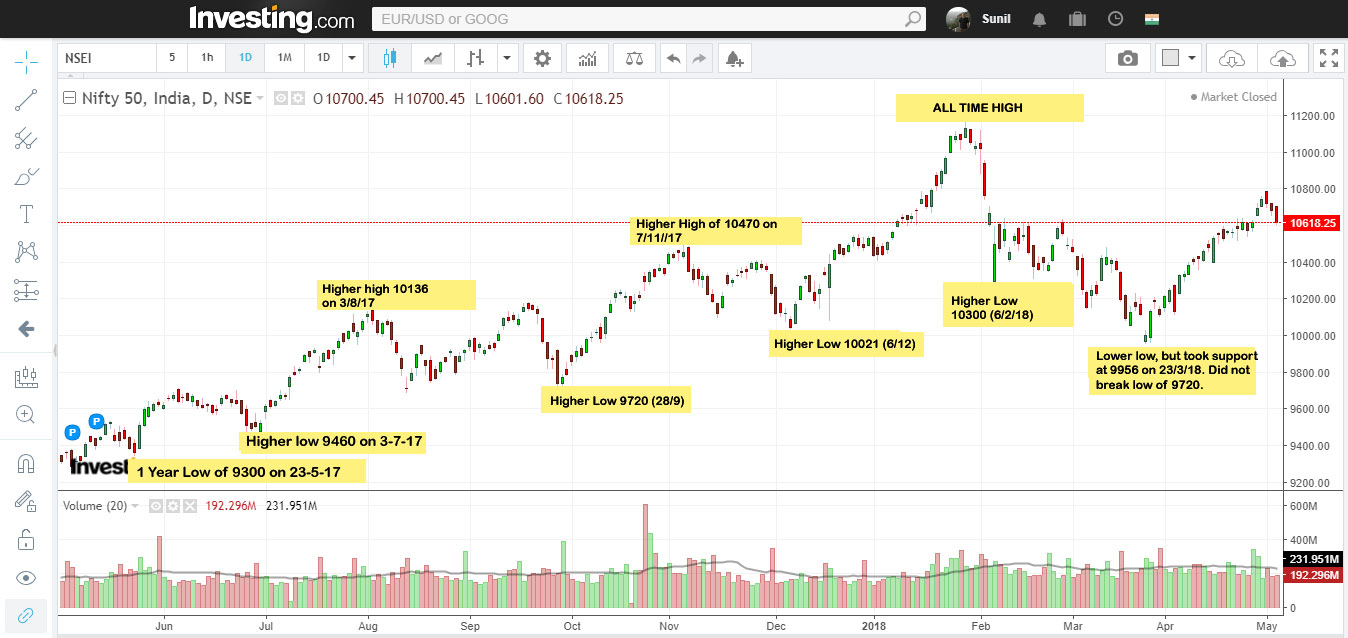
In the chart below I have marked the major lows (9360, 9460, 9720, 10021, 10300 and 9956) and the highs (10135, 10470 and the all time high of 11200).
These are the support and resistance levels in this example. As you can see, the support of 28/9/17 of 9720 has held out so far, and even the support of 10021 was breached, and there was an immediate bounce back.
As far as highs are concerned, when the two highs of 10136 and 10470 were pierced, the NIFTY hit a high of 11200.
Currently the NIFTY is at 10618 above its resistance of 10470. So, if it falls below 10470, then the low of 10300 can hold as the support. And so on. Keep watching the levels to learn the concept.
Now, I have created an example for a 1-day period chart.
Traders and swing traders should determine support and resistance levels after studying 30-minute, 1-hour and 4-hour period charts.
Investors should determine support and resistance levels after studying 1-hour, 1-day and 1-Month period charts.
C. Plotting Moving Averages
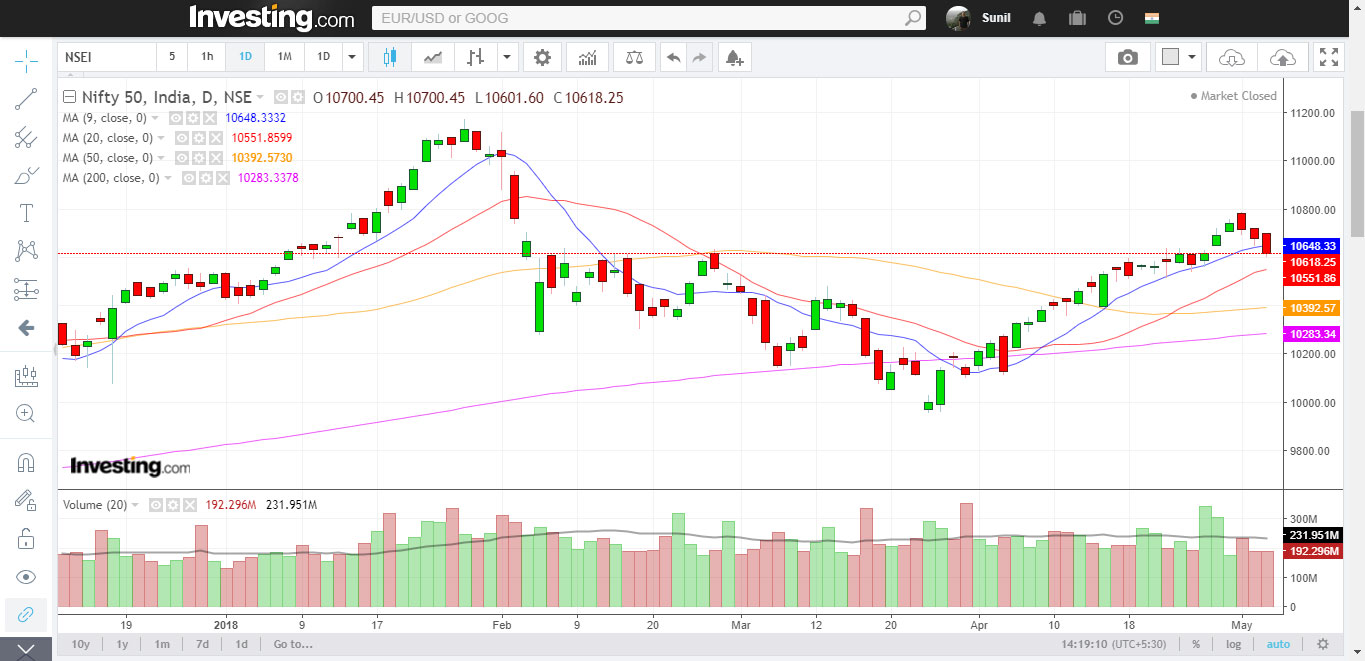
In the example below, I have plotted 4 Moving Averages on a 1-Day Period Chart
9-Day – 10,648
20-Day – 10,551
50-Day – 10,393
200-Day – 10,283
Nifty is at 10,618
It has crossed below the 9-Day MA but is still some distance away from the 20-Day MA. If it falls blow 10551, the next supports are at 10,393 and 10,283.
If it falls below 10,283, and keeps falling,, then there could be real trouble and the next support will be at 10,021 (see section A above).
If you are a trader you should check MAs for support and resistance on 30-minute, 1-hour and 4-hour charts.
A swing trader should check MAs for support and resistance on 1-Hour, 4-hour, and 1-day charts, and even 1-Week charts.
Short and medium term traders can work with Weekly charts.
Long term traders should check Weekly and Month charts.
D. Trendlines
Before reading any further, learn how to draw trendlines here.
Assuming you have read the article, you now know that that if a stock falls below the trendline, it has entered a bear zone, and vice versa.
Additional information:
If you are a trader draw trendines on 30-minute charts.
If you are a swing trader draw trendines on 30-minute charts 1-Hour charts.
If you are a medium term trader draw trendines on 1-day charts.
If you are a long term trader draw trendines on 1-week charts.
Of course, these are my recommendations and you can chop and play around with periods that you are comfortable with.
This is how you can easily determine support and resistance levels.
Good one
Thank you sir,
Very well explained.
good piece of information